Scotch-Irish vs Chinese 3 or more Vehicles in Household
COMPARE
Scotch-Irish
Chinese
3 or more Vehicles in Household
3 or more Vehicles in Household Comparison
Scotch-Irish
Chinese
22.6%
3 OR MORE VEHICLES IN HOUSEHOLD
100.0/ 100
METRIC RATING
49th/ 347
METRIC RANK
23.9%
3 OR MORE VEHICLES IN HOUSEHOLD
100.0/ 100
METRIC RATING
19th/ 347
METRIC RANK
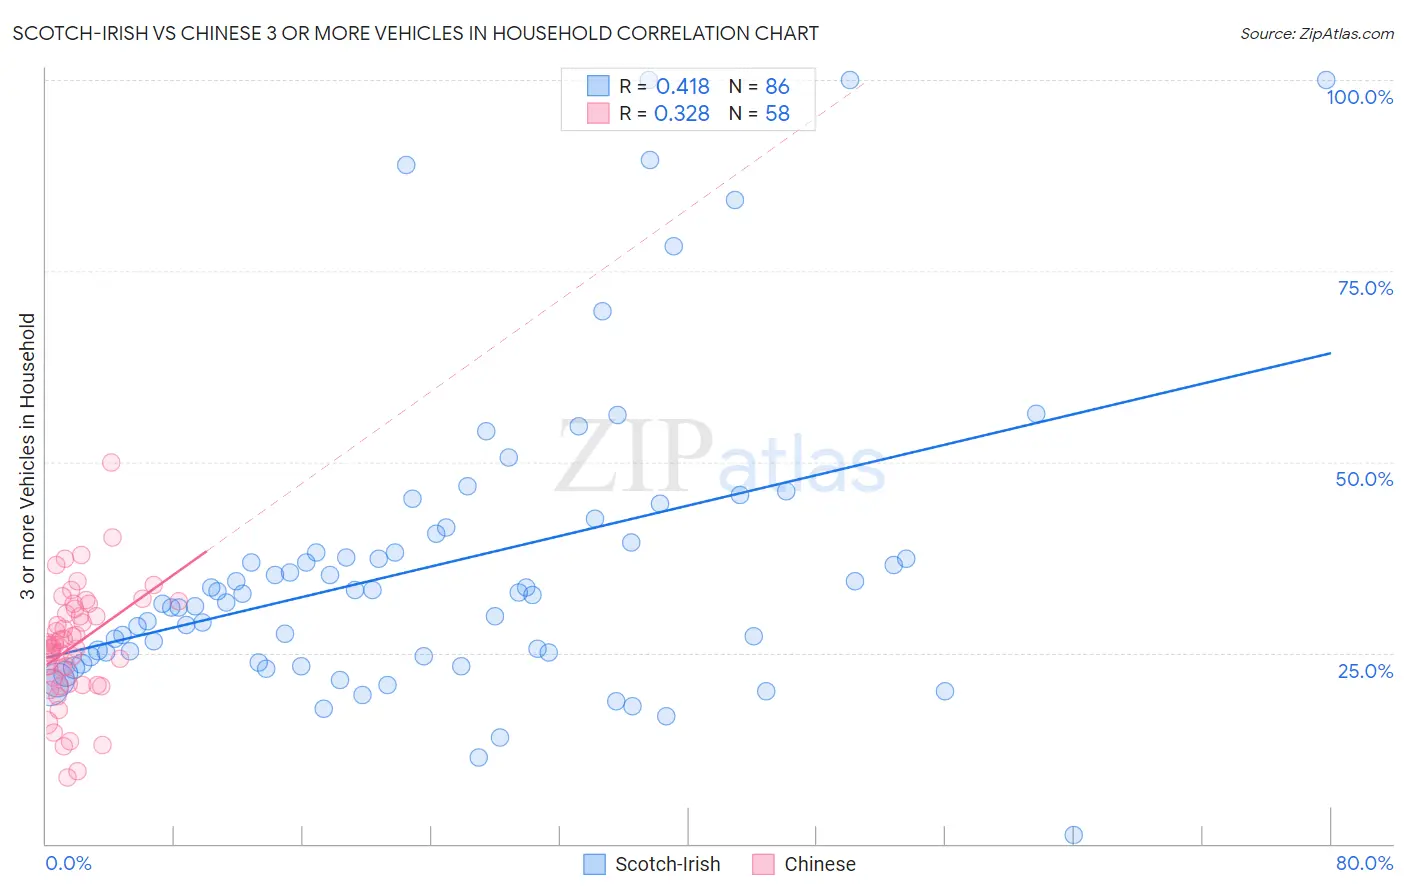
Scotch-Irish vs Chinese 3 or more Vehicles in Household Correlation Chart
The statistical analysis conducted on geographies consisting of 548,181,208 people shows a moderate positive correlation between the proportion of Scotch-Irish and percentage of households with 3 or more vehicles available in the United States with a correlation coefficient (R) of 0.418 and weighted average of 22.6%. Similarly, the statistical analysis conducted on geographies consisting of 64,798,278 people shows a mild positive correlation between the proportion of Chinese and percentage of households with 3 or more vehicles available in the United States with a correlation coefficient (R) of 0.328 and weighted average of 23.9%, a difference of 5.6%.
3 or more Vehicles in Household Correlation Summary
| Measurement | Scotch-Irish | Chinese |
| Minimum | 1.1% | 8.7% |
| Maximum | 100.0% | 49.9% |
| Range | 98.9% | 41.2% |
| Mean | 36.4% | 25.9% |
| Median | 32.1% | 26.0% |
| Interquartile 25% (IQ1) | 24.5% | 21.0% |
| Interquartile 75% (IQ3) | 39.5% | 30.8% |
| Interquartile Range (IQR) | 15.0% | 9.9% |
| Standard Deviation (Sample) | 19.9% | 7.6% |
| Standard Deviation (Population) | 19.8% | 7.5% |
Similar Demographics by 3 or more Vehicles in Household
Demographics Similar to Scotch-Irish by 3 or more Vehicles in Household
In terms of 3 or more vehicles in household, the demographic groups most similar to Scotch-Irish are Sioux (22.6%, a difference of 0.060%), White/Caucasian (22.6%, a difference of 0.060%), Scottish (22.6%, a difference of 0.10%), Malaysian (22.6%, a difference of 0.11%), and Welsh (22.6%, a difference of 0.11%).
| Demographics | Rating | Rank | 3 or more Vehicles in Household |
| Natives/Alaskans | 100.0 /100 | #42 | Exceptional 22.7% |
| Osage | 100.0 /100 | #43 | Exceptional 22.7% |
| Cheyenne | 100.0 /100 | #44 | Exceptional 22.7% |
| Ute | 100.0 /100 | #45 | Exceptional 22.7% |
| Americans | 100.0 /100 | #46 | Exceptional 22.6% |
| Malaysians | 100.0 /100 | #47 | Exceptional 22.6% |
| Scottish | 100.0 /100 | #48 | Exceptional 22.6% |
| Scotch-Irish | 100.0 /100 | #49 | Exceptional 22.6% |
| Sioux | 100.0 /100 | #50 | Exceptional 22.6% |
| Whites/Caucasians | 100.0 /100 | #51 | Exceptional 22.6% |
| Welsh | 100.0 /100 | #52 | Exceptional 22.6% |
| Czechs | 100.0 /100 | #53 | Exceptional 22.5% |
| Crow | 100.0 /100 | #54 | Exceptional 22.5% |
| Immigrants | Laos | 100.0 /100 | #55 | Exceptional 22.4% |
| Hispanics or Latinos | 100.0 /100 | #56 | Exceptional 22.4% |
Demographics Similar to Chinese by 3 or more Vehicles in Household
In terms of 3 or more vehicles in household, the demographic groups most similar to Chinese are Norwegian (23.9%, a difference of 0.030%), Paiute (23.8%, a difference of 0.29%), Immigrants from Vietnam (23.8%, a difference of 0.41%), Immigrants from Philippines (23.8%, a difference of 0.47%), and Korean (24.1%, a difference of 0.82%).
| Demographics | Rating | Rank | 3 or more Vehicles in Household |
| Danes | 100.0 /100 | #12 | Exceptional 24.7% |
| Mexicans | 100.0 /100 | #13 | Exceptional 24.7% |
| Immigrants | Mexico | 100.0 /100 | #14 | Exceptional 24.6% |
| Hawaiians | 100.0 /100 | #15 | Exceptional 24.3% |
| Basques | 100.0 /100 | #16 | Exceptional 24.3% |
| Koreans | 100.0 /100 | #17 | Exceptional 24.1% |
| Norwegians | 100.0 /100 | #18 | Exceptional 23.9% |
| Chinese | 100.0 /100 | #19 | Exceptional 23.9% |
| Paiute | 100.0 /100 | #20 | Exceptional 23.8% |
| Immigrants | Vietnam | 100.0 /100 | #21 | Exceptional 23.8% |
| Immigrants | Philippines | 100.0 /100 | #22 | Exceptional 23.8% |
| Scandinavians | 100.0 /100 | #23 | Exceptional 23.6% |
| Sri Lankans | 100.0 /100 | #24 | Exceptional 23.6% |
| Immigrants | Central America | 100.0 /100 | #25 | Exceptional 23.4% |
| Mexican American Indians | 100.0 /100 | #26 | Exceptional 23.3% |