Scotch-Irish vs Chinese Single Father Poverty
COMPARE
Scotch-Irish
Chinese
Single Father Poverty
Single Father Poverty Comparison
Scotch-Irish
Chinese
18.6%
SINGLE FATHER POVERTY
0.0/ 100
METRIC RATING
306th/ 347
METRIC RANK
15.4%
SINGLE FATHER POVERTY
99.3/ 100
METRIC RATING
83rd/ 347
METRIC RANK
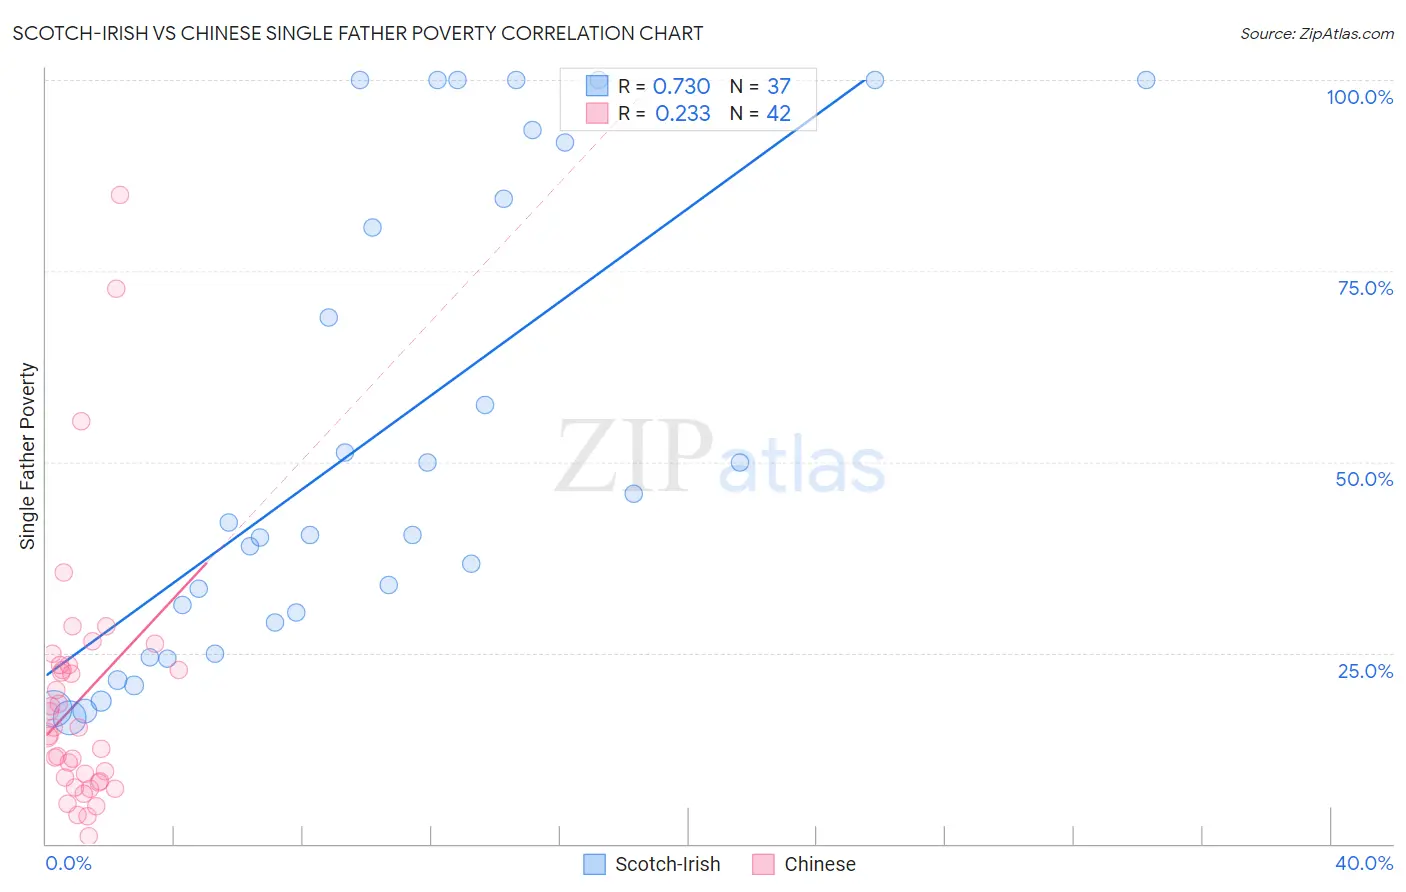
Scotch-Irish vs Chinese Single Father Poverty Correlation Chart
The statistical analysis conducted on geographies consisting of 395,393,443 people shows a strong positive correlation between the proportion of Scotch-Irish and poverty level among single fathers in the United States with a correlation coefficient (R) of 0.730 and weighted average of 18.6%. Similarly, the statistical analysis conducted on geographies consisting of 60,120,579 people shows a weak positive correlation between the proportion of Chinese and poverty level among single fathers in the United States with a correlation coefficient (R) of 0.233 and weighted average of 15.4%, a difference of 20.5%.
Single Father Poverty Correlation Summary
| Measurement | Scotch-Irish | Chinese |
| Minimum | 16.5% | 0.92% |
| Maximum | 100.0% | 85.0% |
| Range | 83.5% | 84.1% |
| Mean | 52.9% | 19.0% |
| Median | 40.5% | 14.7% |
| Interquartile 25% (IQ1) | 27.0% | 8.1% |
| Interquartile 75% (IQ3) | 88.2% | 23.5% |
| Interquartile Range (IQR) | 61.2% | 15.4% |
| Standard Deviation (Sample) | 30.5% | 17.0% |
| Standard Deviation (Population) | 30.1% | 16.8% |
Similar Demographics by Single Father Poverty
Demographics Similar to Scotch-Irish by Single Father Poverty
In terms of single father poverty, the demographic groups most similar to Scotch-Irish are French Canadian (18.6%, a difference of 0.040%), Ottawa (18.6%, a difference of 0.060%), Immigrants from Micronesia (18.6%, a difference of 0.17%), Blackfeet (18.5%, a difference of 0.22%), and Ute (18.5%, a difference of 0.27%).
| Demographics | Rating | Rank | Single Father Poverty |
| Whites/Caucasians | 0.0 /100 | #299 | Tragic 18.4% |
| Immigrants | Dominican Republic | 0.0 /100 | #300 | Tragic 18.4% |
| Hungarians | 0.0 /100 | #301 | Tragic 18.5% |
| Comanche | 0.0 /100 | #302 | Tragic 18.5% |
| Celtics | 0.0 /100 | #303 | Tragic 18.5% |
| Ute | 0.0 /100 | #304 | Tragic 18.5% |
| Blackfeet | 0.0 /100 | #305 | Tragic 18.5% |
| Scotch-Irish | 0.0 /100 | #306 | Tragic 18.6% |
| French Canadians | 0.0 /100 | #307 | Tragic 18.6% |
| Ottawa | 0.0 /100 | #308 | Tragic 18.6% |
| Immigrants | Micronesia | 0.0 /100 | #309 | Tragic 18.6% |
| Chippewa | 0.0 /100 | #310 | Tragic 18.8% |
| Immigrants | Nonimmigrants | 0.0 /100 | #311 | Tragic 18.8% |
| Immigrants | Dominica | 0.0 /100 | #312 | Tragic 18.9% |
| Potawatomi | 0.0 /100 | #313 | Tragic 18.9% |
Demographics Similar to Chinese by Single Father Poverty
In terms of single father poverty, the demographic groups most similar to Chinese are Immigrants from Ukraine (15.4%, a difference of 0.090%), Immigrants from Congo (15.4%, a difference of 0.10%), Armenian (15.4%, a difference of 0.12%), Peruvian (15.4%, a difference of 0.14%), and Immigrants from Oceania (15.4%, a difference of 0.25%).
| Demographics | Rating | Rank | Single Father Poverty |
| Immigrants | Japan | 99.5 /100 | #76 | Exceptional 15.3% |
| Immigrants | Peru | 99.5 /100 | #77 | Exceptional 15.3% |
| Tlingit-Haida | 99.5 /100 | #78 | Exceptional 15.3% |
| Immigrants | Northern Africa | 99.5 /100 | #79 | Exceptional 15.3% |
| Armenians | 99.4 /100 | #80 | Exceptional 15.4% |
| Immigrants | Congo | 99.4 /100 | #81 | Exceptional 15.4% |
| Immigrants | Ukraine | 99.4 /100 | #82 | Exceptional 15.4% |
| Chinese | 99.3 /100 | #83 | Exceptional 15.4% |
| Peruvians | 99.2 /100 | #84 | Exceptional 15.4% |
| Immigrants | Oceania | 99.1 /100 | #85 | Exceptional 15.4% |
| Immigrants | Russia | 99.0 /100 | #86 | Exceptional 15.5% |
| Brazilians | 99.0 /100 | #87 | Exceptional 15.5% |
| Burmese | 99.0 /100 | #88 | Exceptional 15.5% |
| Immigrants | Korea | 99.0 /100 | #89 | Exceptional 15.5% |
| Mexican American Indians | 98.7 /100 | #90 | Exceptional 15.5% |