Samoan vs Immigrants from Hong Kong Ambulatory Disability
COMPARE
Samoan
Immigrants from Hong Kong
Ambulatory Disability
Ambulatory Disability Comparison
Samoans
Immigrants from Hong Kong
6.3%
AMBULATORY DISABILITY
12.1/ 100
METRIC RATING
211th/ 347
METRIC RANK
5.3%
AMBULATORY DISABILITY
100.0/ 100
METRIC RATING
16th/ 347
METRIC RANK
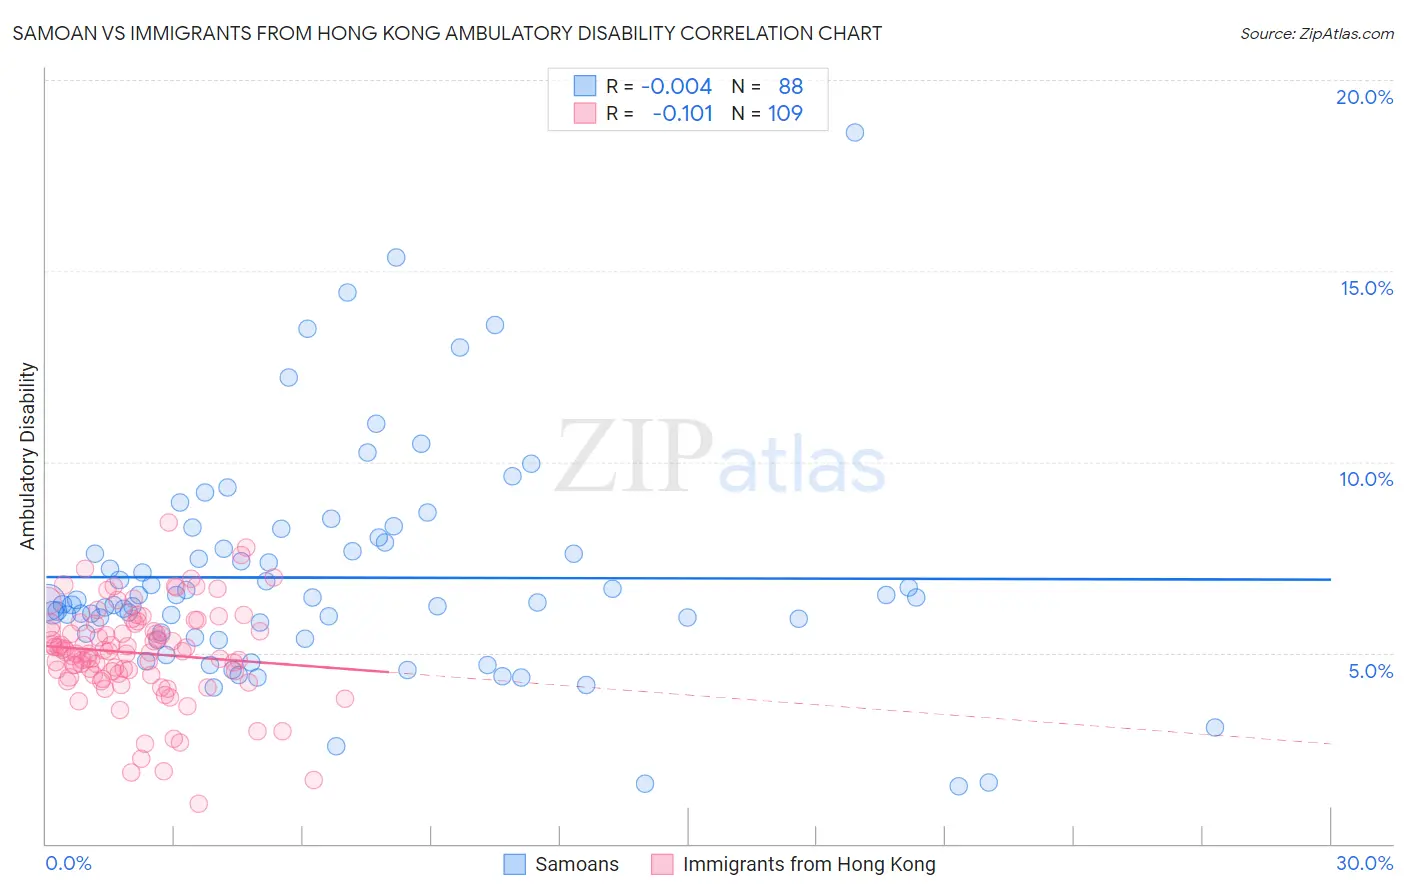
Samoan vs Immigrants from Hong Kong Ambulatory Disability Correlation Chart
The statistical analysis conducted on geographies consisting of 225,059,815 people shows no correlation between the proportion of Samoans and percentage of population with ambulatory disability in the United States with a correlation coefficient (R) of -0.004 and weighted average of 6.3%. Similarly, the statistical analysis conducted on geographies consisting of 253,955,040 people shows a poor negative correlation between the proportion of Immigrants from Hong Kong and percentage of population with ambulatory disability in the United States with a correlation coefficient (R) of -0.101 and weighted average of 5.3%, a difference of 17.6%.
Ambulatory Disability Correlation Summary
| Measurement | Samoan | Immigrants from Hong Kong |
| Minimum | 1.5% | 1.0% |
| Maximum | 18.6% | 8.4% |
| Range | 17.1% | 7.4% |
| Mean | 7.0% | 5.0% |
| Median | 6.3% | 5.0% |
| Interquartile 25% (IQ1) | 5.5% | 4.4% |
| Interquartile 75% (IQ3) | 7.8% | 5.8% |
| Interquartile Range (IQR) | 2.3% | 1.3% |
| Standard Deviation (Sample) | 2.9% | 1.3% |
| Standard Deviation (Population) | 2.9% | 1.3% |
Similar Demographics by Ambulatory Disability
Demographics Similar to Samoans by Ambulatory Disability
In terms of ambulatory disability, the demographic groups most similar to Samoans are Mexican American Indian (6.3%, a difference of 0.010%), Japanese (6.3%, a difference of 0.010%), Immigrants from Mexico (6.3%, a difference of 0.13%), Immigrants from Laos (6.3%, a difference of 0.14%), and Immigrants from Latin America (6.3%, a difference of 0.14%).
| Demographics | Rating | Rank | Ambulatory Disability |
| Immigrants | Congo | 18.2 /100 | #204 | Poor 6.2% |
| Slovenes | 18.0 /100 | #205 | Poor 6.2% |
| Finns | 17.2 /100 | #206 | Poor 6.2% |
| Alsatians | 15.1 /100 | #207 | Poor 6.3% |
| Bangladeshis | 14.2 /100 | #208 | Poor 6.3% |
| Immigrants | Iraq | 14.0 /100 | #209 | Poor 6.3% |
| Immigrants | Laos | 13.2 /100 | #210 | Poor 6.3% |
| Samoans | 12.1 /100 | #211 | Poor 6.3% |
| Mexican American Indians | 12.0 /100 | #212 | Poor 6.3% |
| Japanese | 12.0 /100 | #213 | Poor 6.3% |
| Immigrants | Mexico | 11.0 /100 | #214 | Poor 6.3% |
| Immigrants | Latin America | 11.0 /100 | #215 | Poor 6.3% |
| Canadians | 10.9 /100 | #216 | Poor 6.3% |
| Yugoslavians | 10.9 /100 | #217 | Poor 6.3% |
| Guamanians/Chamorros | 10.6 /100 | #218 | Poor 6.3% |
Demographics Similar to Immigrants from Hong Kong by Ambulatory Disability
In terms of ambulatory disability, the demographic groups most similar to Immigrants from Hong Kong are Immigrants from Ethiopia (5.4%, a difference of 0.34%), Immigrants from Sri Lanka (5.4%, a difference of 0.34%), Indian (Asian) (5.4%, a difference of 0.45%), Ethiopian (5.4%, a difference of 0.47%), and Immigrants from Kuwait (5.4%, a difference of 0.47%).
| Demographics | Rating | Rank | Ambulatory Disability |
| Iranians | 100.0 /100 | #9 | Exceptional 5.1% |
| Yup'ik | 100.0 /100 | #10 | Exceptional 5.2% |
| Immigrants | Korea | 100.0 /100 | #11 | Exceptional 5.2% |
| Okinawans | 100.0 /100 | #12 | Exceptional 5.3% |
| Burmese | 100.0 /100 | #13 | Exceptional 5.3% |
| Immigrants | Eastern Asia | 100.0 /100 | #14 | Exceptional 5.3% |
| Immigrants | China | 100.0 /100 | #15 | Exceptional 5.3% |
| Immigrants | Hong Kong | 100.0 /100 | #16 | Exceptional 5.3% |
| Immigrants | Ethiopia | 100.0 /100 | #17 | Exceptional 5.4% |
| Immigrants | Sri Lanka | 100.0 /100 | #18 | Exceptional 5.4% |
| Indians (Asian) | 100.0 /100 | #19 | Exceptional 5.4% |
| Ethiopians | 100.0 /100 | #20 | Exceptional 5.4% |
| Immigrants | Kuwait | 100.0 /100 | #21 | Exceptional 5.4% |
| Immigrants | Israel | 100.0 /100 | #22 | Exceptional 5.4% |
| Tongans | 100.0 /100 | #23 | Exceptional 5.4% |