Honduran vs Immigrants from Hong Kong Ambulatory Disability
COMPARE
Honduran
Immigrants from Hong Kong
Ambulatory Disability
Ambulatory Disability Comparison
Hondurans
Immigrants from Hong Kong
6.3%
AMBULATORY DISABILITY
6.3/ 100
METRIC RATING
225th/ 347
METRIC RANK
5.3%
AMBULATORY DISABILITY
100.0/ 100
METRIC RATING
16th/ 347
METRIC RANK
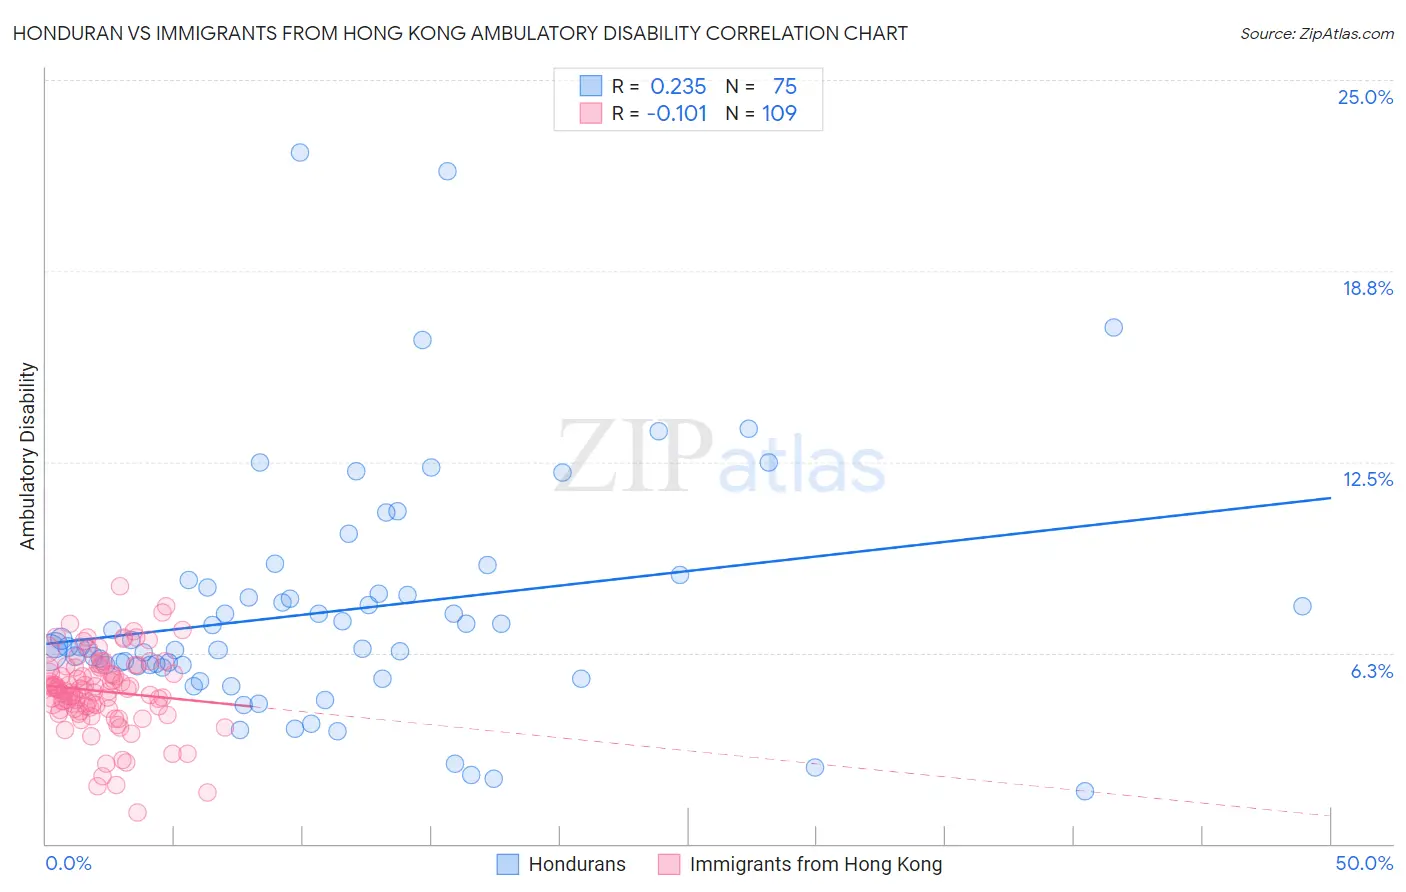
Honduran vs Immigrants from Hong Kong Ambulatory Disability Correlation Chart
The statistical analysis conducted on geographies consisting of 357,719,276 people shows a weak positive correlation between the proportion of Hondurans and percentage of population with ambulatory disability in the United States with a correlation coefficient (R) of 0.235 and weighted average of 6.3%. Similarly, the statistical analysis conducted on geographies consisting of 253,955,040 people shows a poor negative correlation between the proportion of Immigrants from Hong Kong and percentage of population with ambulatory disability in the United States with a correlation coefficient (R) of -0.101 and weighted average of 5.3%, a difference of 18.7%.
Ambulatory Disability Correlation Summary
| Measurement | Honduran | Immigrants from Hong Kong |
| Minimum | 1.7% | 1.0% |
| Maximum | 22.6% | 8.4% |
| Range | 20.9% | 7.4% |
| Mean | 7.6% | 5.0% |
| Median | 6.4% | 5.0% |
| Interquartile 25% (IQ1) | 5.8% | 4.4% |
| Interquartile 75% (IQ3) | 8.4% | 5.8% |
| Interquartile Range (IQR) | 2.6% | 1.3% |
| Standard Deviation (Sample) | 3.9% | 1.3% |
| Standard Deviation (Population) | 3.9% | 1.3% |
Similar Demographics by Ambulatory Disability
Demographics Similar to Hondurans by Ambulatory Disability
In terms of ambulatory disability, the demographic groups most similar to Hondurans are Liberian (6.3%, a difference of 0.17%), Immigrants from Honduras (6.3%, a difference of 0.27%), Slavic (6.4%, a difference of 0.27%), German Russian (6.3%, a difference of 0.56%), and Hungarian (6.3%, a difference of 0.59%).
| Demographics | Rating | Rank | Ambulatory Disability |
| Guamanians/Chamorros | 10.6 /100 | #218 | Poor 6.3% |
| Indonesians | 9.9 /100 | #219 | Tragic 6.3% |
| Immigrants | Albania | 9.6 /100 | #220 | Tragic 6.3% |
| Hungarians | 9.6 /100 | #221 | Tragic 6.3% |
| German Russians | 9.4 /100 | #222 | Tragic 6.3% |
| Immigrants | Honduras | 7.6 /100 | #223 | Tragic 6.3% |
| Liberians | 7.1 /100 | #224 | Tragic 6.3% |
| Hondurans | 6.3 /100 | #225 | Tragic 6.3% |
| Slavs | 5.1 /100 | #226 | Tragic 6.4% |
| Cubans | 4.0 /100 | #227 | Tragic 6.4% |
| Portuguese | 4.0 /100 | #228 | Tragic 6.4% |
| Czechoslovakians | 3.8 /100 | #229 | Tragic 6.4% |
| Mexicans | 3.5 /100 | #230 | Tragic 6.4% |
| Panamanians | 3.1 /100 | #231 | Tragic 6.4% |
| Assyrians/Chaldeans/Syriacs | 2.4 /100 | #232 | Tragic 6.4% |
Demographics Similar to Immigrants from Hong Kong by Ambulatory Disability
In terms of ambulatory disability, the demographic groups most similar to Immigrants from Hong Kong are Immigrants from Ethiopia (5.4%, a difference of 0.34%), Immigrants from Sri Lanka (5.4%, a difference of 0.34%), Indian (Asian) (5.4%, a difference of 0.45%), Ethiopian (5.4%, a difference of 0.47%), and Immigrants from Kuwait (5.4%, a difference of 0.47%).
| Demographics | Rating | Rank | Ambulatory Disability |
| Iranians | 100.0 /100 | #9 | Exceptional 5.1% |
| Yup'ik | 100.0 /100 | #10 | Exceptional 5.2% |
| Immigrants | Korea | 100.0 /100 | #11 | Exceptional 5.2% |
| Okinawans | 100.0 /100 | #12 | Exceptional 5.3% |
| Burmese | 100.0 /100 | #13 | Exceptional 5.3% |
| Immigrants | Eastern Asia | 100.0 /100 | #14 | Exceptional 5.3% |
| Immigrants | China | 100.0 /100 | #15 | Exceptional 5.3% |
| Immigrants | Hong Kong | 100.0 /100 | #16 | Exceptional 5.3% |
| Immigrants | Ethiopia | 100.0 /100 | #17 | Exceptional 5.4% |
| Immigrants | Sri Lanka | 100.0 /100 | #18 | Exceptional 5.4% |
| Indians (Asian) | 100.0 /100 | #19 | Exceptional 5.4% |
| Ethiopians | 100.0 /100 | #20 | Exceptional 5.4% |
| Immigrants | Kuwait | 100.0 /100 | #21 | Exceptional 5.4% |
| Immigrants | Israel | 100.0 /100 | #22 | Exceptional 5.4% |
| Tongans | 100.0 /100 | #23 | Exceptional 5.4% |