Samoan vs Immigrants from Hong Kong Unemployment
COMPARE
Samoan
Immigrants from Hong Kong
Unemployment
Unemployment Comparison
Samoans
Immigrants from Hong Kong
5.5%
UNEMPLOYMENT
7.1/ 100
METRIC RATING
226th/ 347
METRIC RANK
5.2%
UNEMPLOYMENT
75.2/ 100
METRIC RATING
152nd/ 347
METRIC RANK
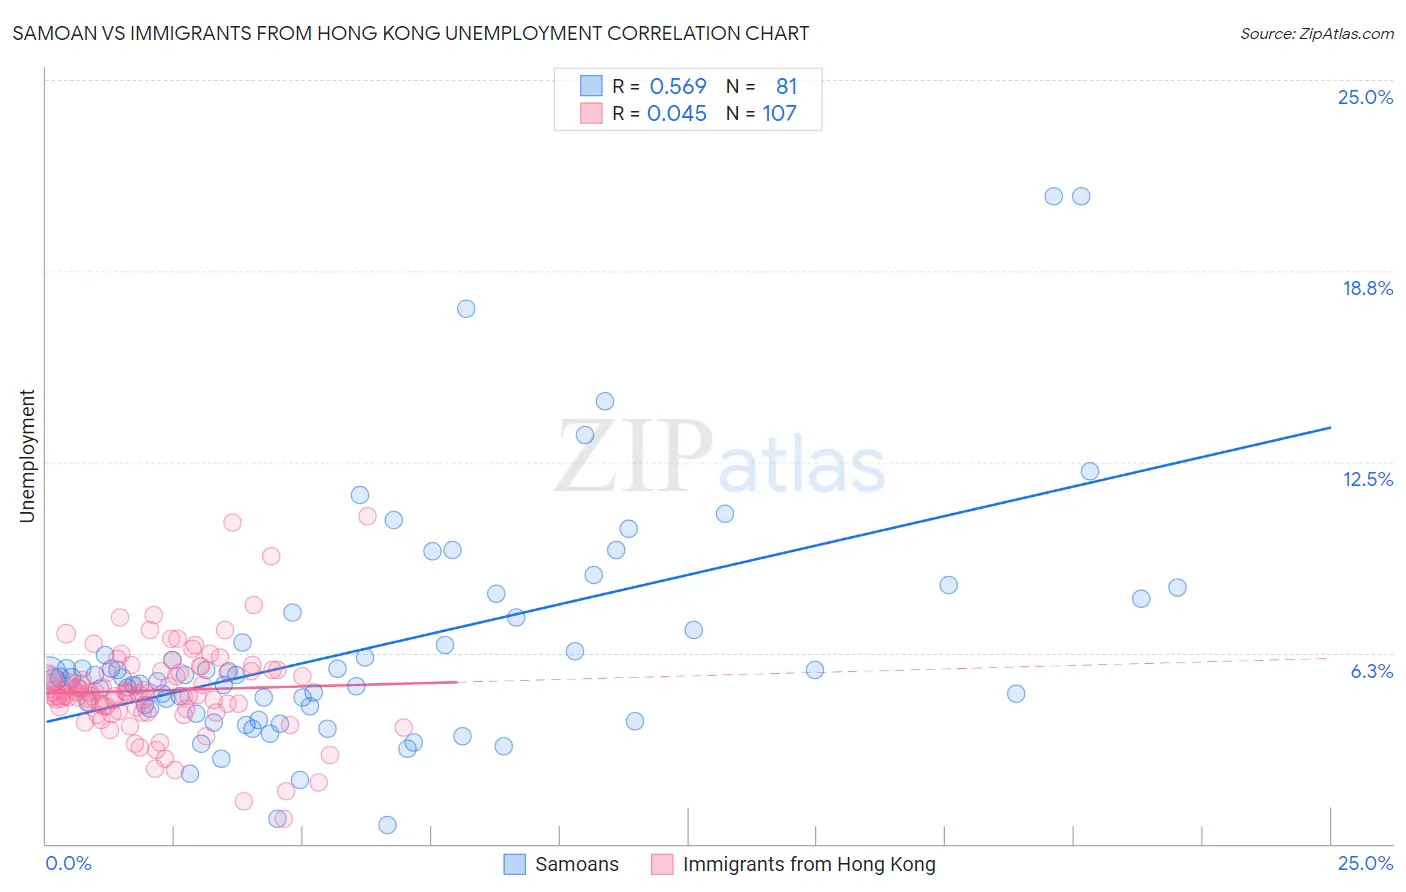
Samoan vs Immigrants from Hong Kong Unemployment Correlation Chart
The statistical analysis conducted on geographies consisting of 225,021,863 people shows a substantial positive correlation between the proportion of Samoans and unemployment in the United States with a correlation coefficient (R) of 0.569 and weighted average of 5.5%. Similarly, the statistical analysis conducted on geographies consisting of 253,937,877 people shows no correlation between the proportion of Immigrants from Hong Kong and unemployment in the United States with a correlation coefficient (R) of 0.045 and weighted average of 5.2%, a difference of 5.8%.
Unemployment Correlation Summary
| Measurement | Samoan | Immigrants from Hong Kong |
| Minimum | 0.60% | 0.80% |
| Maximum | 21.2% | 10.7% |
| Range | 20.6% | 9.9% |
| Mean | 6.4% | 5.0% |
| Median | 5.4% | 4.9% |
| Interquartile 25% (IQ1) | 4.5% | 4.4% |
| Interquartile 75% (IQ3) | 7.2% | 5.6% |
| Interquartile Range (IQR) | 2.7% | 1.2% |
| Standard Deviation (Sample) | 3.7% | 1.5% |
| Standard Deviation (Population) | 3.7% | 1.5% |
Similar Demographics by Unemployment
Demographics Similar to Samoans by Unemployment
In terms of unemployment, the demographic groups most similar to Samoans are Immigrants from Lebanon (5.5%, a difference of 0.030%), South American Indian (5.5%, a difference of 0.15%), Guamanian/Chamorro (5.5%, a difference of 0.18%), Israeli (5.4%, a difference of 0.35%), and Seminole (5.4%, a difference of 0.42%).
| Demographics | Rating | Rank | Unemployment |
| Bangladeshis | 11.2 /100 | #219 | Poor 5.4% |
| Soviet Union | 10.6 /100 | #220 | Poor 5.4% |
| Immigrants | Philippines | 10.4 /100 | #221 | Poor 5.4% |
| Iroquois | 10.3 /100 | #222 | Poor 5.4% |
| Seminole | 9.2 /100 | #223 | Tragic 5.4% |
| Israelis | 8.8 /100 | #224 | Tragic 5.4% |
| South American Indians | 7.8 /100 | #225 | Tragic 5.5% |
| Samoans | 7.1 /100 | #226 | Tragic 5.5% |
| Immigrants | Lebanon | 7.0 /100 | #227 | Tragic 5.5% |
| Guamanians/Chamorros | 6.3 /100 | #228 | Tragic 5.5% |
| Hawaiians | 5.4 /100 | #229 | Tragic 5.5% |
| Ottawa | 5.4 /100 | #230 | Tragic 5.5% |
| Immigrants | Africa | 4.9 /100 | #231 | Tragic 5.5% |
| Comanche | 4.9 /100 | #232 | Tragic 5.5% |
| Immigrants | Syria | 4.8 /100 | #233 | Tragic 5.5% |
Demographics Similar to Immigrants from Hong Kong by Unemployment
In terms of unemployment, the demographic groups most similar to Immigrants from Hong Kong are Egyptian (5.2%, a difference of 0.0%), Immigrants from Eastern Europe (5.2%, a difference of 0.010%), Immigrants from China (5.2%, a difference of 0.040%), Potawatomi (5.2%, a difference of 0.080%), and Syrian (5.2%, a difference of 0.22%).
| Demographics | Rating | Rank | Unemployment |
| Immigrants | Norway | 81.8 /100 | #145 | Excellent 5.1% |
| Immigrants | Asia | 81.8 /100 | #146 | Excellent 5.1% |
| Indians (Asian) | 81.6 /100 | #147 | Excellent 5.1% |
| Immigrants | Italy | 79.1 /100 | #148 | Good 5.1% |
| Syrians | 77.7 /100 | #149 | Good 5.2% |
| Potawatomi | 76.2 /100 | #150 | Good 5.2% |
| Immigrants | Eastern Europe | 75.3 /100 | #151 | Good 5.2% |
| Immigrants | Hong Kong | 75.2 /100 | #152 | Good 5.2% |
| Egyptians | 75.2 /100 | #153 | Good 5.2% |
| Immigrants | China | 74.7 /100 | #154 | Good 5.2% |
| Immigrants | Northern Africa | 71.3 /100 | #155 | Good 5.2% |
| Immigrants | Kazakhstan | 70.4 /100 | #156 | Good 5.2% |
| Sri Lankans | 69.5 /100 | #157 | Good 5.2% |
| Immigrants | Egypt | 66.7 /100 | #158 | Good 5.2% |
| Immigrants | Russia | 66.6 /100 | #159 | Good 5.2% |