Samoan vs Yugoslavian Ambulatory Disability
COMPARE
Samoan
Yugoslavian
Ambulatory Disability
Ambulatory Disability Comparison
Samoans
Yugoslavians
6.3%
AMBULATORY DISABILITY
12.1/ 100
METRIC RATING
211th/ 347
METRIC RANK
6.3%
AMBULATORY DISABILITY
10.9/ 100
METRIC RATING
217th/ 347
METRIC RANK
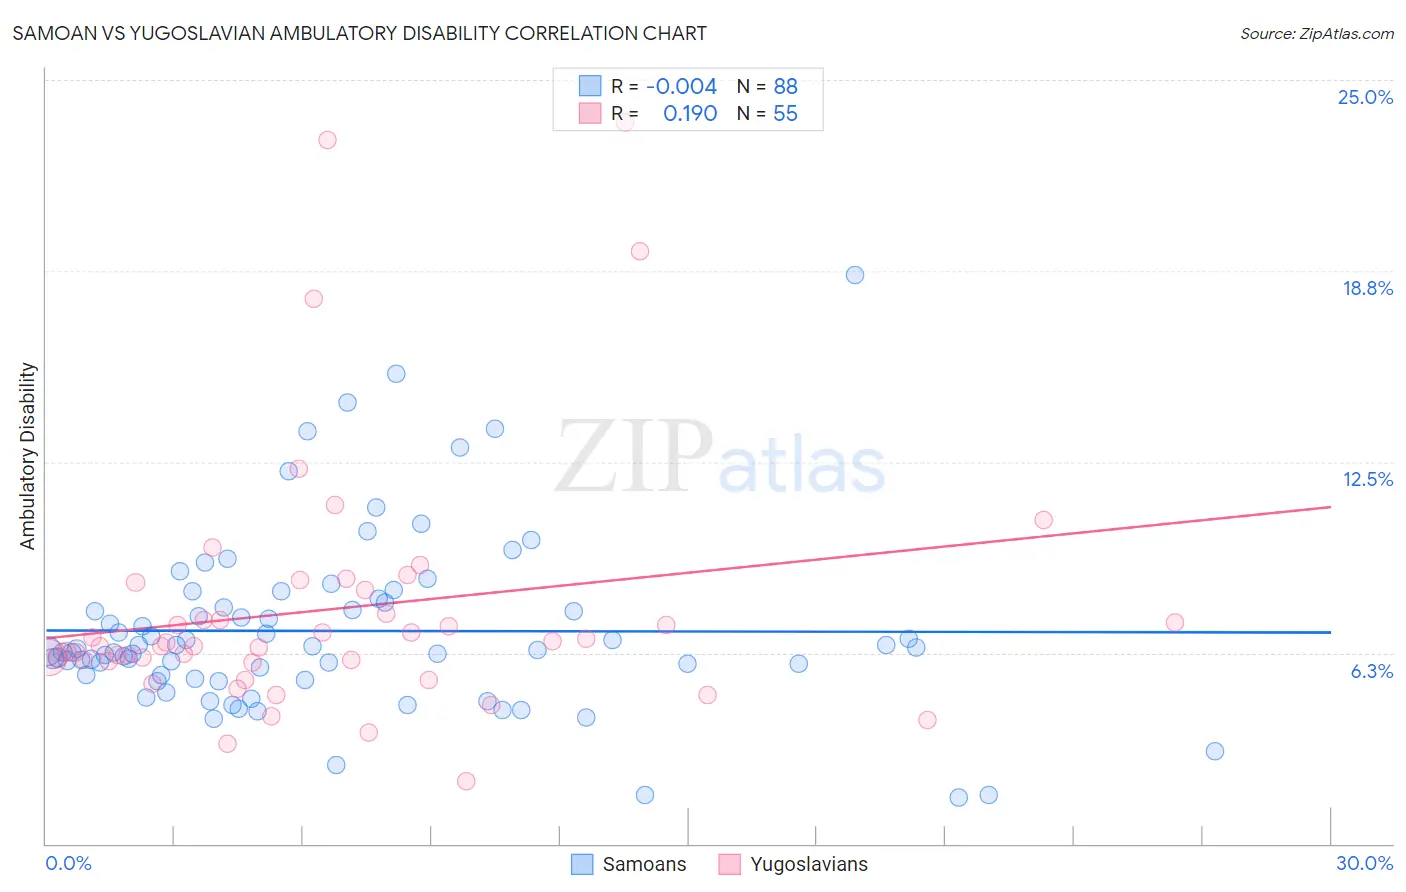
Samoan vs Yugoslavian Ambulatory Disability Correlation Chart
The statistical analysis conducted on geographies consisting of 225,059,815 people shows no correlation between the proportion of Samoans and percentage of population with ambulatory disability in the United States with a correlation coefficient (R) of -0.004 and weighted average of 6.3%. Similarly, the statistical analysis conducted on geographies consisting of 285,658,107 people shows a poor positive correlation between the proportion of Yugoslavians and percentage of population with ambulatory disability in the United States with a correlation coefficient (R) of 0.190 and weighted average of 6.3%, a difference of 0.15%.
Ambulatory Disability Correlation Summary
| Measurement | Samoan | Yugoslavian |
| Minimum | 1.5% | 2.0% |
| Maximum | 18.6% | 23.6% |
| Range | 17.1% | 21.6% |
| Mean | 7.0% | 7.7% |
| Median | 6.3% | 6.5% |
| Interquartile 25% (IQ1) | 5.5% | 6.0% |
| Interquartile 75% (IQ3) | 7.8% | 8.3% |
| Interquartile Range (IQR) | 2.3% | 2.3% |
| Standard Deviation (Sample) | 2.9% | 4.2% |
| Standard Deviation (Population) | 2.9% | 4.2% |
Demographics Similar to Samoans and Yugoslavians by Ambulatory Disability
In terms of ambulatory disability, the demographic groups most similar to Samoans are Mexican American Indian (6.3%, a difference of 0.010%), Japanese (6.3%, a difference of 0.010%), Immigrants from Mexico (6.3%, a difference of 0.13%), Immigrants from Laos (6.3%, a difference of 0.14%), and Immigrants from Latin America (6.3%, a difference of 0.14%). Similarly, the demographic groups most similar to Yugoslavians are Canadian (6.3%, a difference of 0.0%), Immigrants from Latin America (6.3%, a difference of 0.010%), Immigrants from Mexico (6.3%, a difference of 0.020%), Guamanian/Chamorro (6.3%, a difference of 0.040%), and Mexican American Indian (6.3%, a difference of 0.14%).
| Demographics | Rating | Rank | Ambulatory Disability |
| Immigrants | Congo | 18.2 /100 | #204 | Poor 6.2% |
| Slovenes | 18.0 /100 | #205 | Poor 6.2% |
| Finns | 17.2 /100 | #206 | Poor 6.2% |
| Alsatians | 15.1 /100 | #207 | Poor 6.3% |
| Bangladeshis | 14.2 /100 | #208 | Poor 6.3% |
| Immigrants | Iraq | 14.0 /100 | #209 | Poor 6.3% |
| Immigrants | Laos | 13.2 /100 | #210 | Poor 6.3% |
| Samoans | 12.1 /100 | #211 | Poor 6.3% |
| Mexican American Indians | 12.0 /100 | #212 | Poor 6.3% |
| Japanese | 12.0 /100 | #213 | Poor 6.3% |
| Immigrants | Mexico | 11.0 /100 | #214 | Poor 6.3% |
| Immigrants | Latin America | 11.0 /100 | #215 | Poor 6.3% |
| Canadians | 10.9 /100 | #216 | Poor 6.3% |
| Yugoslavians | 10.9 /100 | #217 | Poor 6.3% |
| Guamanians/Chamorros | 10.6 /100 | #218 | Poor 6.3% |
| Indonesians | 9.9 /100 | #219 | Tragic 6.3% |
| Immigrants | Albania | 9.6 /100 | #220 | Tragic 6.3% |
| Hungarians | 9.6 /100 | #221 | Tragic 6.3% |
| German Russians | 9.4 /100 | #222 | Tragic 6.3% |
| Immigrants | Honduras | 7.6 /100 | #223 | Tragic 6.3% |
| Liberians | 7.1 /100 | #224 | Tragic 6.3% |