South African vs Immigrants from Hong Kong Ambulatory Disability
COMPARE
South African
Immigrants from Hong Kong
Ambulatory Disability
Ambulatory Disability Comparison
South Africans
Immigrants from Hong Kong
5.9%
AMBULATORY DISABILITY
96.3/ 100
METRIC RATING
112th/ 347
METRIC RANK
5.3%
AMBULATORY DISABILITY
100.0/ 100
METRIC RATING
16th/ 347
METRIC RANK
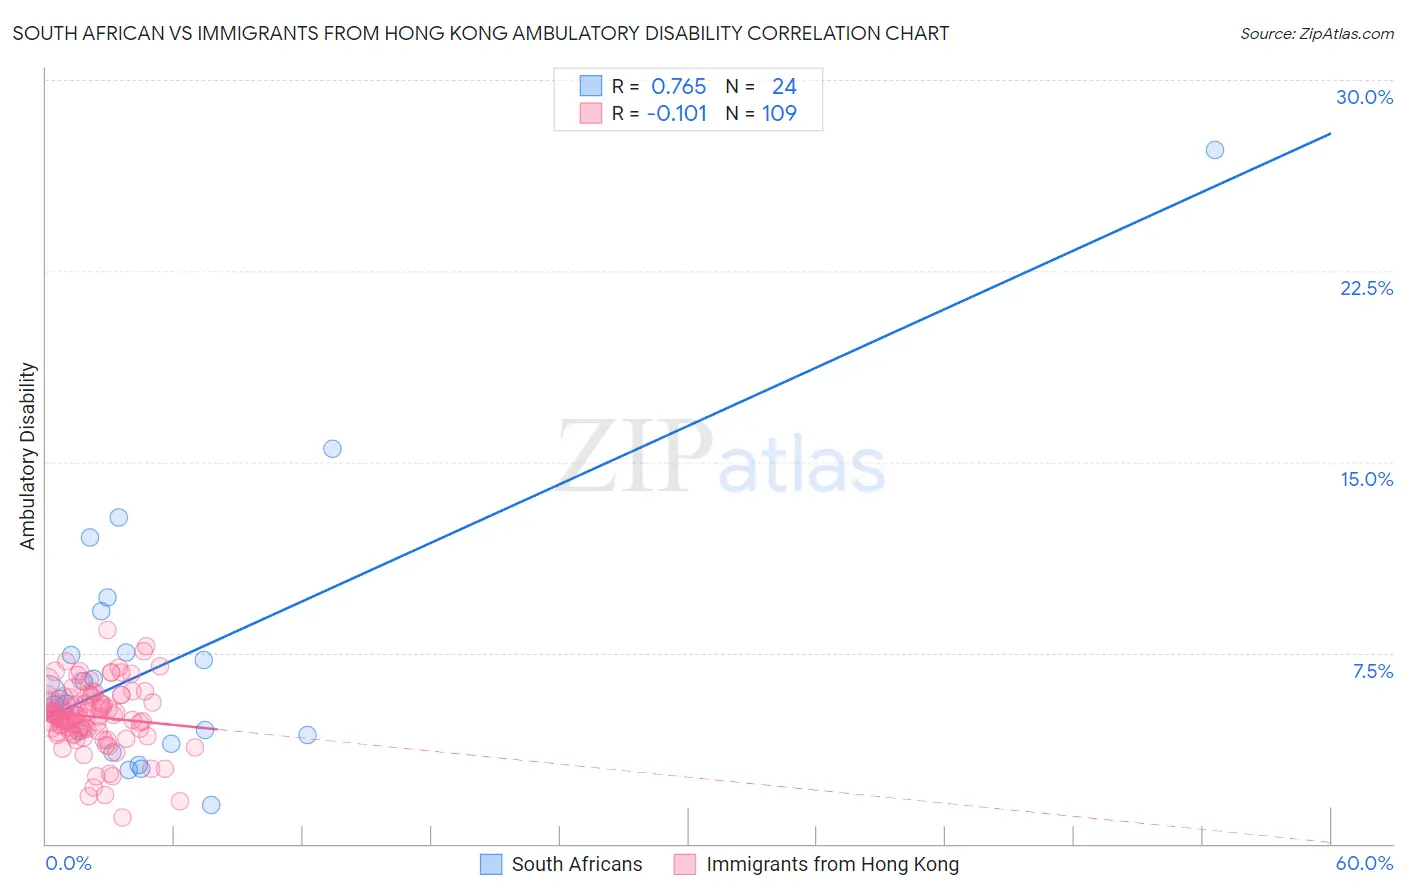
South African vs Immigrants from Hong Kong Ambulatory Disability Correlation Chart
The statistical analysis conducted on geographies consisting of 182,561,768 people shows a strong positive correlation between the proportion of South Africans and percentage of population with ambulatory disability in the United States with a correlation coefficient (R) of 0.765 and weighted average of 5.9%. Similarly, the statistical analysis conducted on geographies consisting of 253,955,040 people shows a poor negative correlation between the proportion of Immigrants from Hong Kong and percentage of population with ambulatory disability in the United States with a correlation coefficient (R) of -0.101 and weighted average of 5.3%, a difference of 9.7%.
Ambulatory Disability Correlation Summary
| Measurement | South African | Immigrants from Hong Kong |
| Minimum | 1.5% | 1.0% |
| Maximum | 27.3% | 8.4% |
| Range | 25.7% | 7.4% |
| Mean | 7.3% | 5.0% |
| Median | 5.8% | 5.0% |
| Interquartile 25% (IQ1) | 4.1% | 4.4% |
| Interquartile 75% (IQ3) | 8.3% | 5.8% |
| Interquartile Range (IQR) | 4.2% | 1.3% |
| Standard Deviation (Sample) | 5.4% | 1.3% |
| Standard Deviation (Population) | 5.3% | 1.3% |
Similar Demographics by Ambulatory Disability
Demographics Similar to South Africans by Ambulatory Disability
In terms of ambulatory disability, the demographic groups most similar to South Africans are Danish (5.8%, a difference of 0.13%), Immigrants from Colombia (5.8%, a difference of 0.20%), Immigrants from Uruguay (5.9%, a difference of 0.22%), Immigrants from Poland (5.9%, a difference of 0.28%), and Immigrants from Netherlands (5.8%, a difference of 0.38%).
| Demographics | Rating | Rank | Ambulatory Disability |
| Immigrants | Czechoslovakia | 97.4 /100 | #105 | Exceptional 5.8% |
| Immigrants | Morocco | 97.3 /100 | #106 | Exceptional 5.8% |
| Uruguayans | 97.2 /100 | #107 | Exceptional 5.8% |
| Colombians | 97.2 /100 | #108 | Exceptional 5.8% |
| Immigrants | Netherlands | 97.1 /100 | #109 | Exceptional 5.8% |
| Immigrants | Colombia | 96.7 /100 | #110 | Exceptional 5.8% |
| Danes | 96.6 /100 | #111 | Exceptional 5.8% |
| South Africans | 96.3 /100 | #112 | Exceptional 5.9% |
| Immigrants | Uruguay | 95.6 /100 | #113 | Exceptional 5.9% |
| Immigrants | Poland | 95.4 /100 | #114 | Exceptional 5.9% |
| South American Indians | 94.8 /100 | #115 | Exceptional 5.9% |
| Immigrants | Africa | 94.7 /100 | #116 | Exceptional 5.9% |
| Immigrants | South Eastern Asia | 93.6 /100 | #117 | Exceptional 5.9% |
| Russians | 93.4 /100 | #118 | Exceptional 5.9% |
| Norwegians | 93.1 /100 | #119 | Exceptional 5.9% |
Demographics Similar to Immigrants from Hong Kong by Ambulatory Disability
In terms of ambulatory disability, the demographic groups most similar to Immigrants from Hong Kong are Immigrants from Ethiopia (5.4%, a difference of 0.34%), Immigrants from Sri Lanka (5.4%, a difference of 0.34%), Indian (Asian) (5.4%, a difference of 0.45%), Ethiopian (5.4%, a difference of 0.47%), and Immigrants from Kuwait (5.4%, a difference of 0.47%).
| Demographics | Rating | Rank | Ambulatory Disability |
| Iranians | 100.0 /100 | #9 | Exceptional 5.1% |
| Yup'ik | 100.0 /100 | #10 | Exceptional 5.2% |
| Immigrants | Korea | 100.0 /100 | #11 | Exceptional 5.2% |
| Okinawans | 100.0 /100 | #12 | Exceptional 5.3% |
| Burmese | 100.0 /100 | #13 | Exceptional 5.3% |
| Immigrants | Eastern Asia | 100.0 /100 | #14 | Exceptional 5.3% |
| Immigrants | China | 100.0 /100 | #15 | Exceptional 5.3% |
| Immigrants | Hong Kong | 100.0 /100 | #16 | Exceptional 5.3% |
| Immigrants | Ethiopia | 100.0 /100 | #17 | Exceptional 5.4% |
| Immigrants | Sri Lanka | 100.0 /100 | #18 | Exceptional 5.4% |
| Indians (Asian) | 100.0 /100 | #19 | Exceptional 5.4% |
| Ethiopians | 100.0 /100 | #20 | Exceptional 5.4% |
| Immigrants | Kuwait | 100.0 /100 | #21 | Exceptional 5.4% |
| Immigrants | Israel | 100.0 /100 | #22 | Exceptional 5.4% |
| Tongans | 100.0 /100 | #23 | Exceptional 5.4% |