Samoan vs Immigrants from Iran Ambulatory Disability
COMPARE
Samoan
Immigrants from Iran
Ambulatory Disability
Ambulatory Disability Comparison
Samoans
Immigrants from Iran
6.3%
AMBULATORY DISABILITY
12.1/ 100
METRIC RATING
211th/ 347
METRIC RANK
5.4%
AMBULATORY DISABILITY
100.0/ 100
METRIC RATING
29th/ 347
METRIC RANK
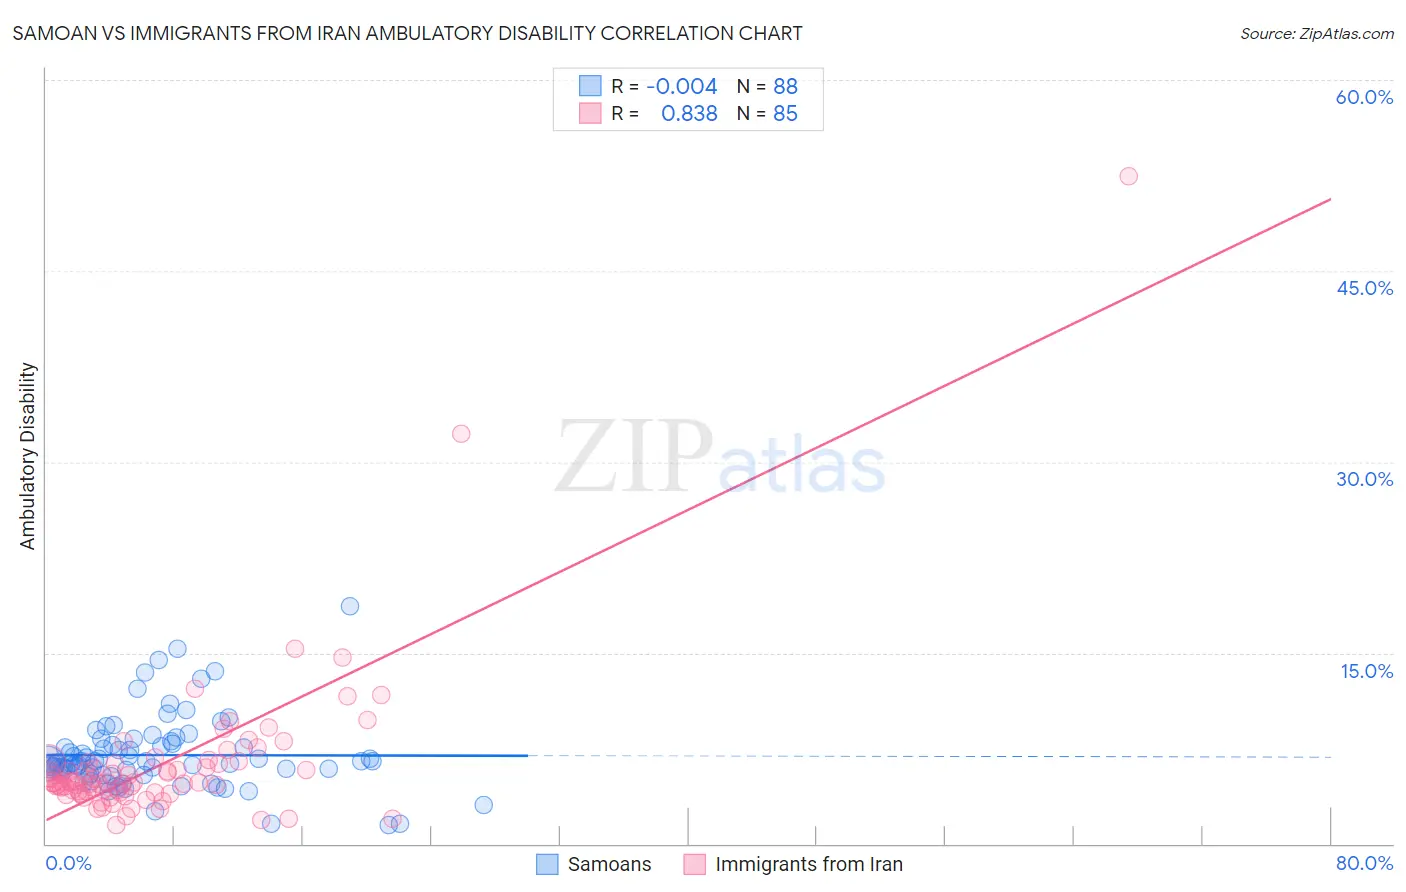
Samoan vs Immigrants from Iran Ambulatory Disability Correlation Chart
The statistical analysis conducted on geographies consisting of 225,059,815 people shows no correlation between the proportion of Samoans and percentage of population with ambulatory disability in the United States with a correlation coefficient (R) of -0.004 and weighted average of 6.3%. Similarly, the statistical analysis conducted on geographies consisting of 279,879,747 people shows a very strong positive correlation between the proportion of Immigrants from Iran and percentage of population with ambulatory disability in the United States with a correlation coefficient (R) of 0.838 and weighted average of 5.4%, a difference of 16.0%.
Ambulatory Disability Correlation Summary
| Measurement | Samoan | Immigrants from Iran |
| Minimum | 1.5% | 1.5% |
| Maximum | 18.6% | 52.5% |
| Range | 17.1% | 51.0% |
| Mean | 7.0% | 6.3% |
| Median | 6.3% | 4.8% |
| Interquartile 25% (IQ1) | 5.5% | 4.0% |
| Interquartile 75% (IQ3) | 7.8% | 6.3% |
| Interquartile Range (IQR) | 2.3% | 2.3% |
| Standard Deviation (Sample) | 2.9% | 6.4% |
| Standard Deviation (Population) | 2.9% | 6.3% |
Similar Demographics by Ambulatory Disability
Demographics Similar to Samoans by Ambulatory Disability
In terms of ambulatory disability, the demographic groups most similar to Samoans are Mexican American Indian (6.3%, a difference of 0.010%), Japanese (6.3%, a difference of 0.010%), Immigrants from Mexico (6.3%, a difference of 0.13%), Immigrants from Laos (6.3%, a difference of 0.14%), and Immigrants from Latin America (6.3%, a difference of 0.14%).
| Demographics | Rating | Rank | Ambulatory Disability |
| Immigrants | Congo | 18.2 /100 | #204 | Poor 6.2% |
| Slovenes | 18.0 /100 | #205 | Poor 6.2% |
| Finns | 17.2 /100 | #206 | Poor 6.2% |
| Alsatians | 15.1 /100 | #207 | Poor 6.3% |
| Bangladeshis | 14.2 /100 | #208 | Poor 6.3% |
| Immigrants | Iraq | 14.0 /100 | #209 | Poor 6.3% |
| Immigrants | Laos | 13.2 /100 | #210 | Poor 6.3% |
| Samoans | 12.1 /100 | #211 | Poor 6.3% |
| Mexican American Indians | 12.0 /100 | #212 | Poor 6.3% |
| Japanese | 12.0 /100 | #213 | Poor 6.3% |
| Immigrants | Mexico | 11.0 /100 | #214 | Poor 6.3% |
| Immigrants | Latin America | 11.0 /100 | #215 | Poor 6.3% |
| Canadians | 10.9 /100 | #216 | Poor 6.3% |
| Yugoslavians | 10.9 /100 | #217 | Poor 6.3% |
| Guamanians/Chamorros | 10.6 /100 | #218 | Poor 6.3% |
Demographics Similar to Immigrants from Iran by Ambulatory Disability
In terms of ambulatory disability, the demographic groups most similar to Immigrants from Iran are Cambodian (5.4%, a difference of 0.10%), Asian (5.4%, a difference of 0.16%), Immigrants from Nepal (5.4%, a difference of 0.32%), Zimbabwean (5.4%, a difference of 0.35%), and Immigrants from Saudi Arabia (5.4%, a difference of 0.43%).
| Demographics | Rating | Rank | Ambulatory Disability |
| Immigrants | Israel | 100.0 /100 | #22 | Exceptional 5.4% |
| Tongans | 100.0 /100 | #23 | Exceptional 5.4% |
| Immigrants | Saudi Arabia | 100.0 /100 | #24 | Exceptional 5.4% |
| Zimbabweans | 100.0 /100 | #25 | Exceptional 5.4% |
| Immigrants | Nepal | 100.0 /100 | #26 | Exceptional 5.4% |
| Asians | 100.0 /100 | #27 | Exceptional 5.4% |
| Cambodians | 100.0 /100 | #28 | Exceptional 5.4% |
| Immigrants | Iran | 100.0 /100 | #29 | Exceptional 5.4% |
| Immigrants | Turkey | 100.0 /100 | #30 | Exceptional 5.4% |
| Immigrants | Venezuela | 100.0 /100 | #31 | Exceptional 5.4% |
| Immigrants | Australia | 100.0 /100 | #32 | Exceptional 5.5% |
| Immigrants | Pakistan | 100.0 /100 | #33 | Exceptional 5.5% |
| Immigrants | Asia | 100.0 /100 | #34 | Exceptional 5.5% |
| Afghans | 100.0 /100 | #35 | Exceptional 5.5% |
| Immigrants | Malaysia | 100.0 /100 | #36 | Exceptional 5.5% |