Samoan vs Czech Ambulatory Disability
COMPARE
Samoan
Czech
Ambulatory Disability
Ambulatory Disability Comparison
Samoans
Czechs
6.3%
AMBULATORY DISABILITY
12.1/ 100
METRIC RATING
211th/ 347
METRIC RANK
6.0%
AMBULATORY DISABILITY
83.3/ 100
METRIC RATING
140th/ 347
METRIC RANK
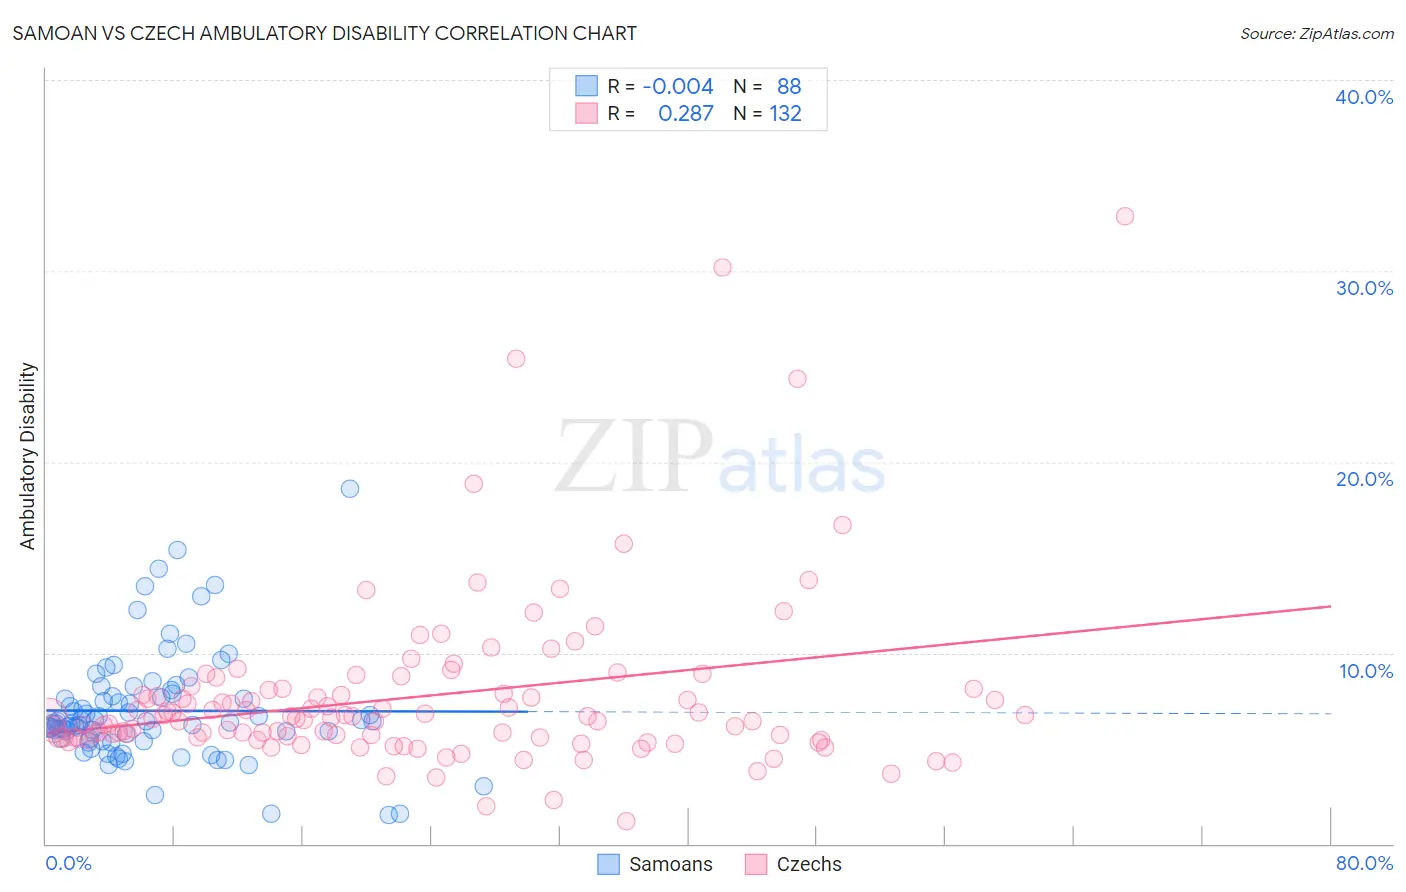
Samoan vs Czech Ambulatory Disability Correlation Chart
The statistical analysis conducted on geographies consisting of 225,059,815 people shows no correlation between the proportion of Samoans and percentage of population with ambulatory disability in the United States with a correlation coefficient (R) of -0.004 and weighted average of 6.3%. Similarly, the statistical analysis conducted on geographies consisting of 484,584,263 people shows a weak positive correlation between the proportion of Czechs and percentage of population with ambulatory disability in the United States with a correlation coefficient (R) of 0.287 and weighted average of 6.0%, a difference of 4.9%.
Ambulatory Disability Correlation Summary
| Measurement | Samoan | Czech |
| Minimum | 1.5% | 1.2% |
| Maximum | 18.6% | 32.8% |
| Range | 17.1% | 31.6% |
| Mean | 7.0% | 7.7% |
| Median | 6.3% | 6.6% |
| Interquartile 25% (IQ1) | 5.5% | 5.6% |
| Interquartile 75% (IQ3) | 7.8% | 7.9% |
| Interquartile Range (IQR) | 2.3% | 2.4% |
| Standard Deviation (Sample) | 2.9% | 4.6% |
| Standard Deviation (Population) | 2.9% | 4.5% |
Similar Demographics by Ambulatory Disability
Demographics Similar to Samoans by Ambulatory Disability
In terms of ambulatory disability, the demographic groups most similar to Samoans are Mexican American Indian (6.3%, a difference of 0.010%), Japanese (6.3%, a difference of 0.010%), Immigrants from Mexico (6.3%, a difference of 0.13%), Immigrants from Laos (6.3%, a difference of 0.14%), and Immigrants from Latin America (6.3%, a difference of 0.14%).
| Demographics | Rating | Rank | Ambulatory Disability |
| Immigrants | Congo | 18.2 /100 | #204 | Poor 6.2% |
| Slovenes | 18.0 /100 | #205 | Poor 6.2% |
| Finns | 17.2 /100 | #206 | Poor 6.2% |
| Alsatians | 15.1 /100 | #207 | Poor 6.3% |
| Bangladeshis | 14.2 /100 | #208 | Poor 6.3% |
| Immigrants | Iraq | 14.0 /100 | #209 | Poor 6.3% |
| Immigrants | Laos | 13.2 /100 | #210 | Poor 6.3% |
| Samoans | 12.1 /100 | #211 | Poor 6.3% |
| Mexican American Indians | 12.0 /100 | #212 | Poor 6.3% |
| Japanese | 12.0 /100 | #213 | Poor 6.3% |
| Immigrants | Mexico | 11.0 /100 | #214 | Poor 6.3% |
| Immigrants | Latin America | 11.0 /100 | #215 | Poor 6.3% |
| Canadians | 10.9 /100 | #216 | Poor 6.3% |
| Yugoslavians | 10.9 /100 | #217 | Poor 6.3% |
| Guamanians/Chamorros | 10.6 /100 | #218 | Poor 6.3% |
Demographics Similar to Czechs by Ambulatory Disability
In terms of ambulatory disability, the demographic groups most similar to Czechs are Swedish (6.0%, a difference of 0.020%), Immigrants from Zaire (6.0%, a difference of 0.030%), Immigrants from Philippines (6.0%, a difference of 0.030%), Romanian (6.0%, a difference of 0.040%), and Macedonian (6.0%, a difference of 0.050%).
| Demographics | Rating | Rank | Ambulatory Disability |
| Immigrants | Immigrants | 86.9 /100 | #133 | Excellent 6.0% |
| Ute | 86.6 /100 | #134 | Excellent 6.0% |
| Immigrants | Italy | 85.0 /100 | #135 | Excellent 6.0% |
| Immigrants | North Macedonia | 84.1 /100 | #136 | Excellent 6.0% |
| Immigrants | Syria | 84.1 /100 | #137 | Excellent 6.0% |
| Immigrants | Hungary | 83.9 /100 | #138 | Excellent 6.0% |
| Immigrants | Zaire | 83.6 /100 | #139 | Excellent 6.0% |
| Czechs | 83.3 /100 | #140 | Excellent 6.0% |
| Swedes | 83.1 /100 | #141 | Excellent 6.0% |
| Immigrants | Philippines | 83.0 /100 | #142 | Excellent 6.0% |
| Romanians | 82.9 /100 | #143 | Excellent 6.0% |
| Macedonians | 82.8 /100 | #144 | Excellent 6.0% |
| Pakistanis | 82.5 /100 | #145 | Excellent 6.0% |
| Immigrants | Greece | 82.5 /100 | #146 | Excellent 6.0% |
| Immigrants | Moldova | 82.4 /100 | #147 | Excellent 6.0% |