Arab vs Immigrants from Hong Kong Ambulatory Disability
COMPARE
Arab
Immigrants from Hong Kong
Ambulatory Disability
Ambulatory Disability Comparison
Arabs
Immigrants from Hong Kong
5.9%
AMBULATORY DISABILITY
91.5/ 100
METRIC RATING
126th/ 347
METRIC RANK
5.3%
AMBULATORY DISABILITY
100.0/ 100
METRIC RATING
16th/ 347
METRIC RANK
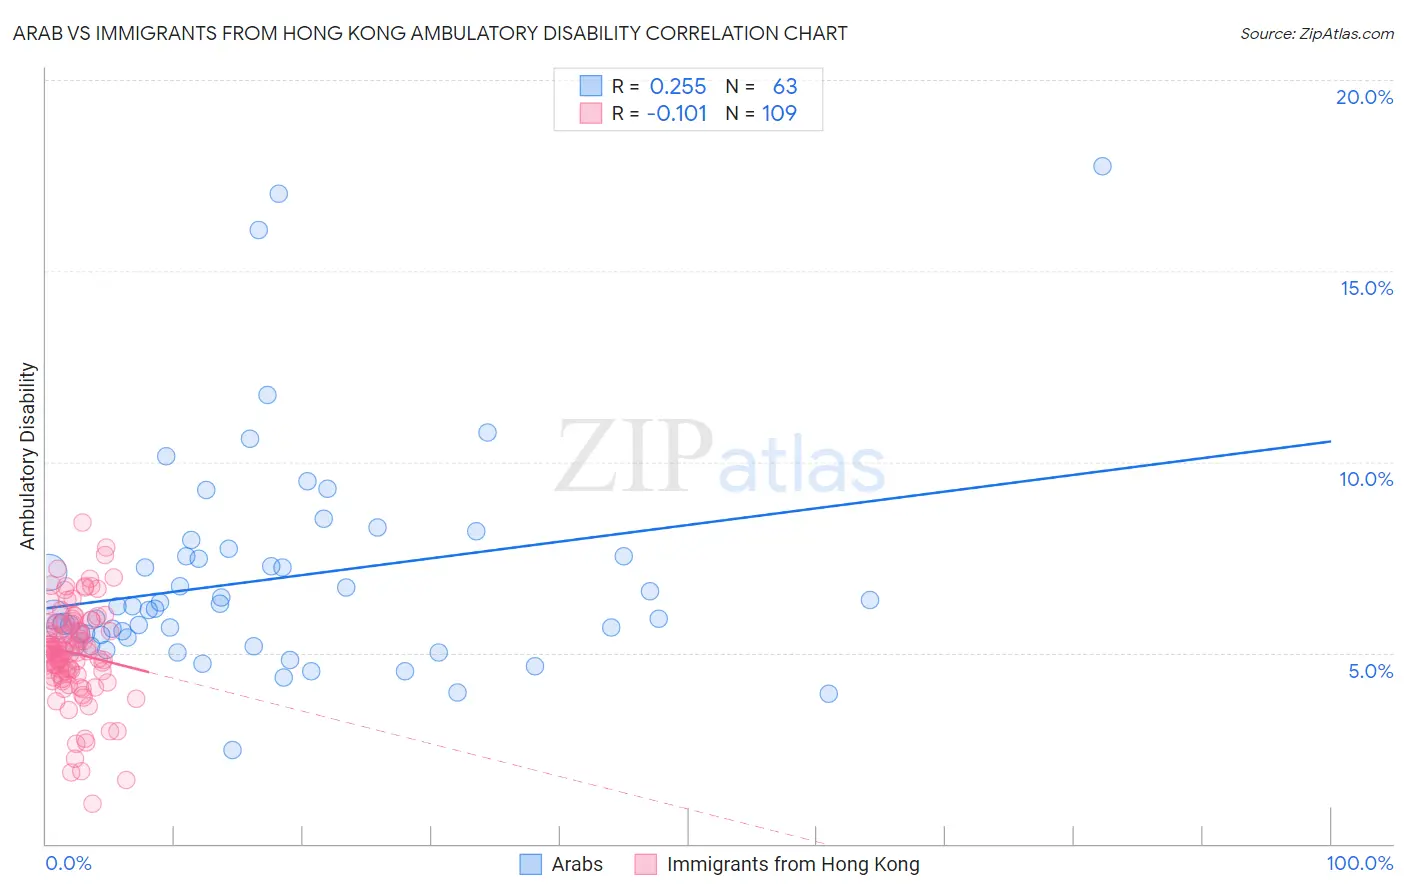
Arab vs Immigrants from Hong Kong Ambulatory Disability Correlation Chart
The statistical analysis conducted on geographies consisting of 486,612,258 people shows a weak positive correlation between the proportion of Arabs and percentage of population with ambulatory disability in the United States with a correlation coefficient (R) of 0.255 and weighted average of 5.9%. Similarly, the statistical analysis conducted on geographies consisting of 253,955,040 people shows a poor negative correlation between the proportion of Immigrants from Hong Kong and percentage of population with ambulatory disability in the United States with a correlation coefficient (R) of -0.101 and weighted average of 5.3%, a difference of 11.0%.
Ambulatory Disability Correlation Summary
| Measurement | Arab | Immigrants from Hong Kong |
| Minimum | 2.5% | 1.0% |
| Maximum | 17.8% | 8.4% |
| Range | 15.3% | 7.4% |
| Mean | 7.0% | 5.0% |
| Median | 6.2% | 5.0% |
| Interquartile 25% (IQ1) | 5.4% | 4.4% |
| Interquartile 75% (IQ3) | 7.5% | 5.8% |
| Interquartile Range (IQR) | 2.1% | 1.3% |
| Standard Deviation (Sample) | 2.9% | 1.3% |
| Standard Deviation (Population) | 2.8% | 1.3% |
Similar Demographics by Ambulatory Disability
Demographics Similar to Arabs by Ambulatory Disability
In terms of ambulatory disability, the demographic groups most similar to Arabs are Korean (5.9%, a difference of 0.020%), Immigrants from Nigeria (5.9%, a difference of 0.10%), Immigrants from Western Asia (5.9%, a difference of 0.13%), Immigrants from Middle Africa (5.9%, a difference of 0.14%), and Immigrants from Norway (5.9%, a difference of 0.17%).
| Demographics | Rating | Rank | Ambulatory Disability |
| Norwegians | 93.1 /100 | #119 | Exceptional 5.9% |
| Estonians | 92.9 /100 | #120 | Exceptional 5.9% |
| Costa Ricans | 92.6 /100 | #121 | Exceptional 5.9% |
| Icelanders | 92.6 /100 | #122 | Exceptional 5.9% |
| Immigrants | Russia | 92.4 /100 | #123 | Exceptional 5.9% |
| Immigrants | Middle Africa | 92.2 /100 | #124 | Exceptional 5.9% |
| Koreans | 91.6 /100 | #125 | Exceptional 5.9% |
| Arabs | 91.5 /100 | #126 | Exceptional 5.9% |
| Immigrants | Nigeria | 90.9 /100 | #127 | Exceptional 5.9% |
| Immigrants | Western Asia | 90.7 /100 | #128 | Exceptional 5.9% |
| Immigrants | Norway | 90.5 /100 | #129 | Exceptional 5.9% |
| Immigrants | Kazakhstan | 89.7 /100 | #130 | Excellent 5.9% |
| Immigrants | Costa Rica | 89.5 /100 | #131 | Excellent 5.9% |
| Immigrants | Europe | 87.8 /100 | #132 | Excellent 6.0% |
| Immigrants | Immigrants | 86.9 /100 | #133 | Excellent 6.0% |
Demographics Similar to Immigrants from Hong Kong by Ambulatory Disability
In terms of ambulatory disability, the demographic groups most similar to Immigrants from Hong Kong are Immigrants from Ethiopia (5.4%, a difference of 0.34%), Immigrants from Sri Lanka (5.4%, a difference of 0.34%), Indian (Asian) (5.4%, a difference of 0.45%), Ethiopian (5.4%, a difference of 0.47%), and Immigrants from Kuwait (5.4%, a difference of 0.47%).
| Demographics | Rating | Rank | Ambulatory Disability |
| Iranians | 100.0 /100 | #9 | Exceptional 5.1% |
| Yup'ik | 100.0 /100 | #10 | Exceptional 5.2% |
| Immigrants | Korea | 100.0 /100 | #11 | Exceptional 5.2% |
| Okinawans | 100.0 /100 | #12 | Exceptional 5.3% |
| Burmese | 100.0 /100 | #13 | Exceptional 5.3% |
| Immigrants | Eastern Asia | 100.0 /100 | #14 | Exceptional 5.3% |
| Immigrants | China | 100.0 /100 | #15 | Exceptional 5.3% |
| Immigrants | Hong Kong | 100.0 /100 | #16 | Exceptional 5.3% |
| Immigrants | Ethiopia | 100.0 /100 | #17 | Exceptional 5.4% |
| Immigrants | Sri Lanka | 100.0 /100 | #18 | Exceptional 5.4% |
| Indians (Asian) | 100.0 /100 | #19 | Exceptional 5.4% |
| Ethiopians | 100.0 /100 | #20 | Exceptional 5.4% |
| Immigrants | Kuwait | 100.0 /100 | #21 | Exceptional 5.4% |
| Immigrants | Israel | 100.0 /100 | #22 | Exceptional 5.4% |
| Tongans | 100.0 /100 | #23 | Exceptional 5.4% |