Samoan vs Immigrants from Hong Kong Professional Degree
COMPARE
Samoan
Immigrants from Hong Kong
Professional Degree
Professional Degree Comparison
Samoans
Immigrants from Hong Kong
3.3%
PROFESSIONAL DEGREE
0.1/ 100
METRIC RATING
307th/ 347
METRIC RANK
6.4%
PROFESSIONAL DEGREE
100.0/ 100
METRIC RATING
21st/ 347
METRIC RANK
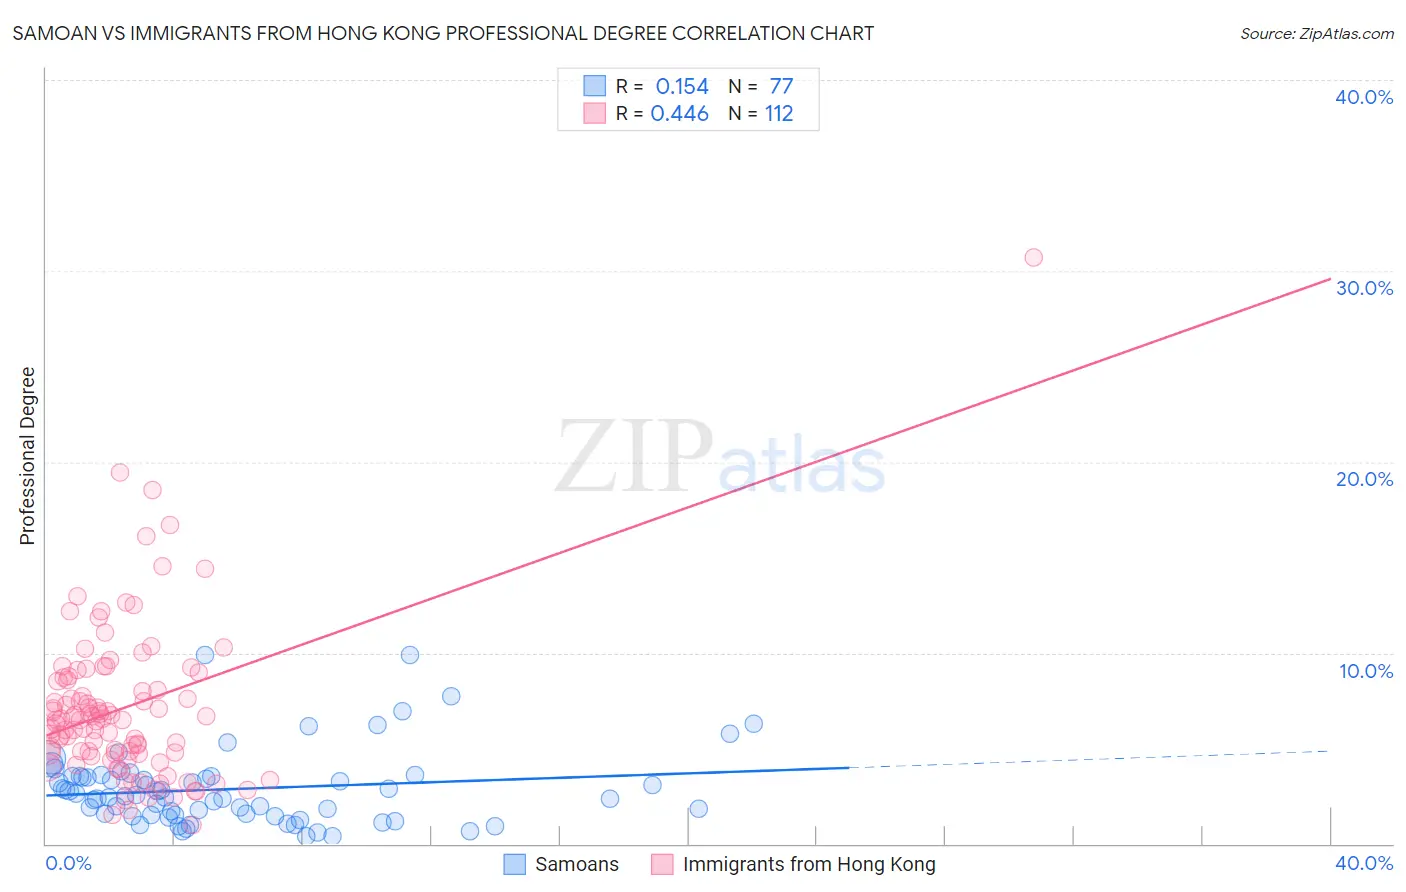
Samoan vs Immigrants from Hong Kong Professional Degree Correlation Chart
The statistical analysis conducted on geographies consisting of 224,756,232 people shows a poor positive correlation between the proportion of Samoans and percentage of population with at least professional degree education in the United States with a correlation coefficient (R) of 0.154 and weighted average of 3.3%. Similarly, the statistical analysis conducted on geographies consisting of 253,893,385 people shows a moderate positive correlation between the proportion of Immigrants from Hong Kong and percentage of population with at least professional degree education in the United States with a correlation coefficient (R) of 0.446 and weighted average of 6.4%, a difference of 92.7%.
Professional Degree Correlation Summary
| Measurement | Samoan | Immigrants from Hong Kong |
| Minimum | 0.40% | 0.97% |
| Maximum | 9.9% | 30.7% |
| Range | 9.5% | 29.8% |
| Mean | 2.9% | 7.1% |
| Median | 2.5% | 6.5% |
| Interquartile 25% (IQ1) | 1.5% | 4.8% |
| Interquartile 75% (IQ3) | 3.5% | 8.6% |
| Interquartile Range (IQR) | 2.1% | 3.9% |
| Standard Deviation (Sample) | 1.9% | 4.1% |
| Standard Deviation (Population) | 1.9% | 4.1% |
Similar Demographics by Professional Degree
Demographics Similar to Samoans by Professional Degree
In terms of professional degree, the demographic groups most similar to Samoans are Shoshone (3.3%, a difference of 0.50%), Pima (3.3%, a difference of 0.51%), Immigrants from Latin America (3.3%, a difference of 0.83%), Cherokee (3.3%, a difference of 0.99%), and Cape Verdean (3.4%, a difference of 1.1%).
| Demographics | Rating | Rank | Professional Degree |
| Blacks/African Americans | 0.2 /100 | #300 | Tragic 3.4% |
| Immigrants | Dominican Republic | 0.2 /100 | #301 | Tragic 3.4% |
| Malaysians | 0.2 /100 | #302 | Tragic 3.4% |
| Immigrants | Haiti | 0.2 /100 | #303 | Tragic 3.4% |
| Cajuns | 0.2 /100 | #304 | Tragic 3.4% |
| Chickasaw | 0.1 /100 | #305 | Tragic 3.4% |
| Cape Verdeans | 0.1 /100 | #306 | Tragic 3.4% |
| Samoans | 0.1 /100 | #307 | Tragic 3.3% |
| Shoshone | 0.1 /100 | #308 | Tragic 3.3% |
| Pima | 0.1 /100 | #309 | Tragic 3.3% |
| Immigrants | Latin America | 0.1 /100 | #310 | Tragic 3.3% |
| Cherokee | 0.1 /100 | #311 | Tragic 3.3% |
| Sioux | 0.1 /100 | #312 | Tragic 3.3% |
| Yuman | 0.1 /100 | #313 | Tragic 3.3% |
| Mexican American Indians | 0.1 /100 | #314 | Tragic 3.3% |
Demographics Similar to Immigrants from Hong Kong by Professional Degree
In terms of professional degree, the demographic groups most similar to Immigrants from Hong Kong are Immigrants from Denmark (6.4%, a difference of 0.22%), Immigrants from Japan (6.4%, a difference of 0.73%), Russian (6.3%, a difference of 1.2%), Immigrants from Spain (6.3%, a difference of 1.3%), and Immigrants from Ireland (6.3%, a difference of 1.7%).
| Demographics | Rating | Rank | Professional Degree |
| Immigrants | France | 100.0 /100 | #14 | Exceptional 6.8% |
| Immigrants | China | 100.0 /100 | #15 | Exceptional 6.7% |
| Immigrants | Sweden | 100.0 /100 | #16 | Exceptional 6.7% |
| Immigrants | Eastern Asia | 100.0 /100 | #17 | Exceptional 6.6% |
| Soviet Union | 100.0 /100 | #18 | Exceptional 6.6% |
| Indians (Asian) | 100.0 /100 | #19 | Exceptional 6.5% |
| Immigrants | Denmark | 100.0 /100 | #20 | Exceptional 6.4% |
| Immigrants | Hong Kong | 100.0 /100 | #21 | Exceptional 6.4% |
| Immigrants | Japan | 100.0 /100 | #22 | Exceptional 6.4% |
| Russians | 100.0 /100 | #23 | Exceptional 6.3% |
| Immigrants | Spain | 100.0 /100 | #24 | Exceptional 6.3% |
| Immigrants | Ireland | 100.0 /100 | #25 | Exceptional 6.3% |
| Latvians | 100.0 /100 | #26 | Exceptional 6.2% |
| Immigrants | Northern Europe | 100.0 /100 | #27 | Exceptional 6.2% |
| Turks | 100.0 /100 | #28 | Exceptional 6.2% |