Immigrants from Dominica vs Czech Ambulatory Disability
COMPARE
Immigrants from Dominica
Czech
Ambulatory Disability
Ambulatory Disability Comparison
Immigrants from Dominica
Czechs
6.9%
AMBULATORY DISABILITY
0.0/ 100
METRIC RATING
289th/ 347
METRIC RANK
6.0%
AMBULATORY DISABILITY
83.3/ 100
METRIC RATING
140th/ 347
METRIC RANK
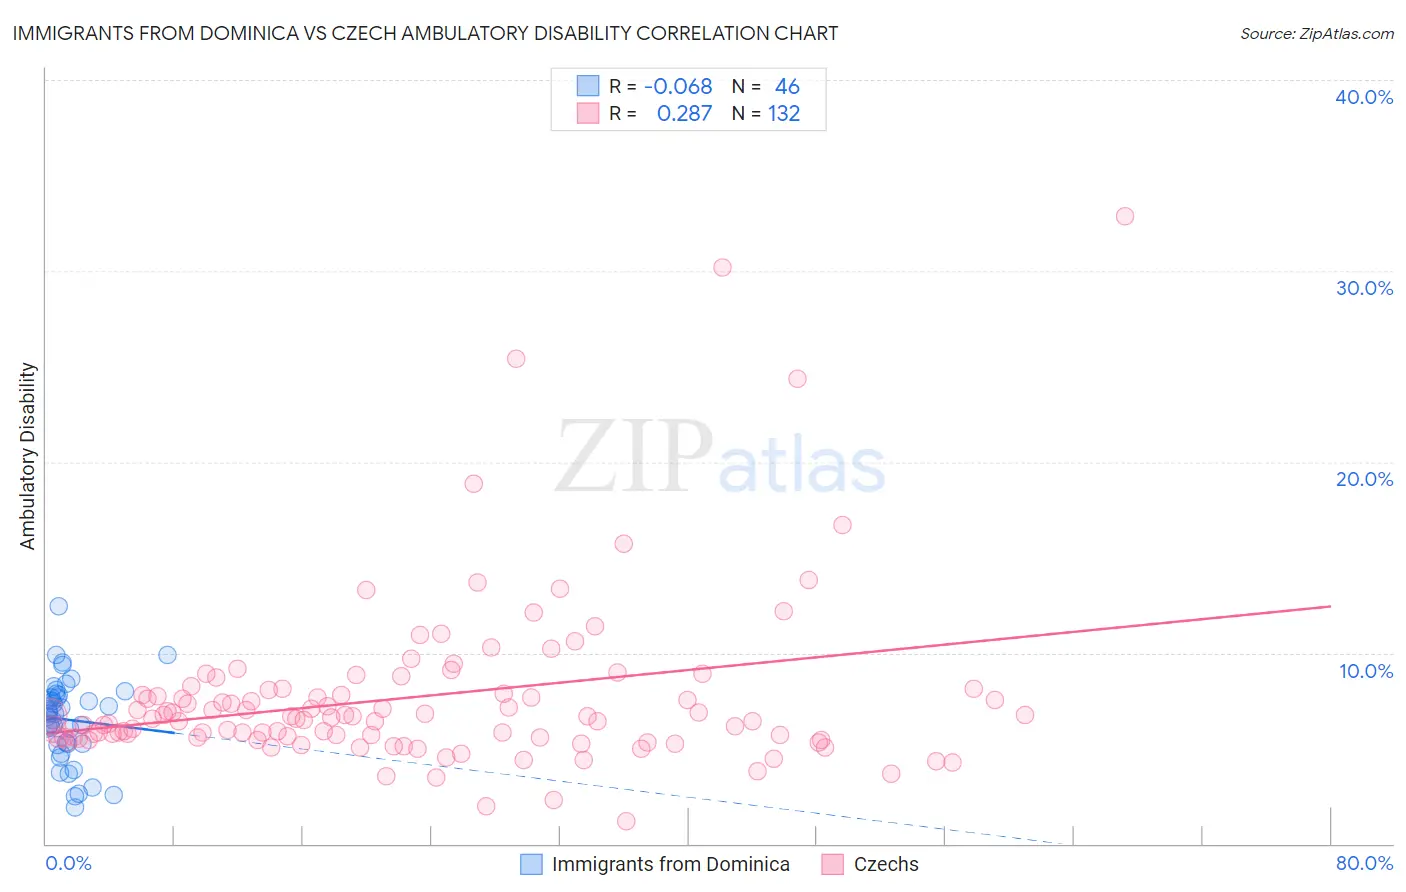
Immigrants from Dominica vs Czech Ambulatory Disability Correlation Chart
The statistical analysis conducted on geographies consisting of 83,791,064 people shows a slight negative correlation between the proportion of Immigrants from Dominica and percentage of population with ambulatory disability in the United States with a correlation coefficient (R) of -0.068 and weighted average of 6.9%. Similarly, the statistical analysis conducted on geographies consisting of 484,584,263 people shows a weak positive correlation between the proportion of Czechs and percentage of population with ambulatory disability in the United States with a correlation coefficient (R) of 0.287 and weighted average of 6.0%, a difference of 14.6%.
Ambulatory Disability Correlation Summary
| Measurement | Immigrants from Dominica | Czech |
| Minimum | 1.9% | 1.2% |
| Maximum | 12.5% | 32.8% |
| Range | 10.6% | 31.6% |
| Mean | 6.5% | 7.7% |
| Median | 6.8% | 6.6% |
| Interquartile 25% (IQ1) | 5.2% | 5.6% |
| Interquartile 75% (IQ3) | 7.8% | 7.9% |
| Interquartile Range (IQR) | 2.6% | 2.4% |
| Standard Deviation (Sample) | 2.2% | 4.6% |
| Standard Deviation (Population) | 2.2% | 4.5% |
Similar Demographics by Ambulatory Disability
Demographics Similar to Immigrants from Dominica by Ambulatory Disability
In terms of ambulatory disability, the demographic groups most similar to Immigrants from Dominica are Scotch-Irish (6.9%, a difference of 0.030%), West Indian (6.9%, a difference of 0.12%), Nonimmigrants (6.9%, a difference of 0.14%), Cheyenne (6.9%, a difference of 0.19%), and U.S. Virgin Islander (6.8%, a difference of 0.41%).
| Demographics | Rating | Rank | Ambulatory Disability |
| Barbadians | 0.0 /100 | #282 | Tragic 6.8% |
| Immigrants | Barbados | 0.0 /100 | #283 | Tragic 6.8% |
| Immigrants | Jamaica | 0.0 /100 | #284 | Tragic 6.8% |
| Fijians | 0.0 /100 | #285 | Tragic 6.8% |
| Yakama | 0.0 /100 | #286 | Tragic 6.8% |
| U.S. Virgin Islanders | 0.0 /100 | #287 | Tragic 6.8% |
| Immigrants | Nonimmigrants | 0.0 /100 | #288 | Tragic 6.9% |
| Immigrants | Dominica | 0.0 /100 | #289 | Tragic 6.9% |
| Scotch-Irish | 0.0 /100 | #290 | Tragic 6.9% |
| West Indians | 0.0 /100 | #291 | Tragic 6.9% |
| Cheyenne | 0.0 /100 | #292 | Tragic 6.9% |
| Immigrants | St. Vincent and the Grenadines | 0.0 /100 | #293 | Tragic 6.9% |
| Cape Verdeans | 0.0 /100 | #294 | Tragic 6.9% |
| Crow | 0.0 /100 | #295 | Tragic 6.9% |
| Alaskan Athabascans | 0.0 /100 | #296 | Tragic 6.9% |
Demographics Similar to Czechs by Ambulatory Disability
In terms of ambulatory disability, the demographic groups most similar to Czechs are Swedish (6.0%, a difference of 0.020%), Immigrants from Zaire (6.0%, a difference of 0.030%), Immigrants from Philippines (6.0%, a difference of 0.030%), Romanian (6.0%, a difference of 0.040%), and Macedonian (6.0%, a difference of 0.050%).
| Demographics | Rating | Rank | Ambulatory Disability |
| Immigrants | Immigrants | 86.9 /100 | #133 | Excellent 6.0% |
| Ute | 86.6 /100 | #134 | Excellent 6.0% |
| Immigrants | Italy | 85.0 /100 | #135 | Excellent 6.0% |
| Immigrants | North Macedonia | 84.1 /100 | #136 | Excellent 6.0% |
| Immigrants | Syria | 84.1 /100 | #137 | Excellent 6.0% |
| Immigrants | Hungary | 83.9 /100 | #138 | Excellent 6.0% |
| Immigrants | Zaire | 83.6 /100 | #139 | Excellent 6.0% |
| Czechs | 83.3 /100 | #140 | Excellent 6.0% |
| Swedes | 83.1 /100 | #141 | Excellent 6.0% |
| Immigrants | Philippines | 83.0 /100 | #142 | Excellent 6.0% |
| Romanians | 82.9 /100 | #143 | Excellent 6.0% |
| Macedonians | 82.8 /100 | #144 | Excellent 6.0% |
| Pakistanis | 82.5 /100 | #145 | Excellent 6.0% |
| Immigrants | Greece | 82.5 /100 | #146 | Excellent 6.0% |
| Immigrants | Moldova | 82.4 /100 | #147 | Excellent 6.0% |