Samoan vs Czech In Labor Force | Age 16-19
COMPARE
Samoan
Czech
In Labor Force | Age 16-19
In Labor Force | Age 16-19 Comparison
Samoans
Czechs
39.1%
IN LABOR FORCE | AGE 16-19
99.6/ 100
METRIC RATING
86th/ 347
METRIC RANK
43.6%
IN LABOR FORCE | AGE 16-19
100.0/ 100
METRIC RATING
16th/ 347
METRIC RANK
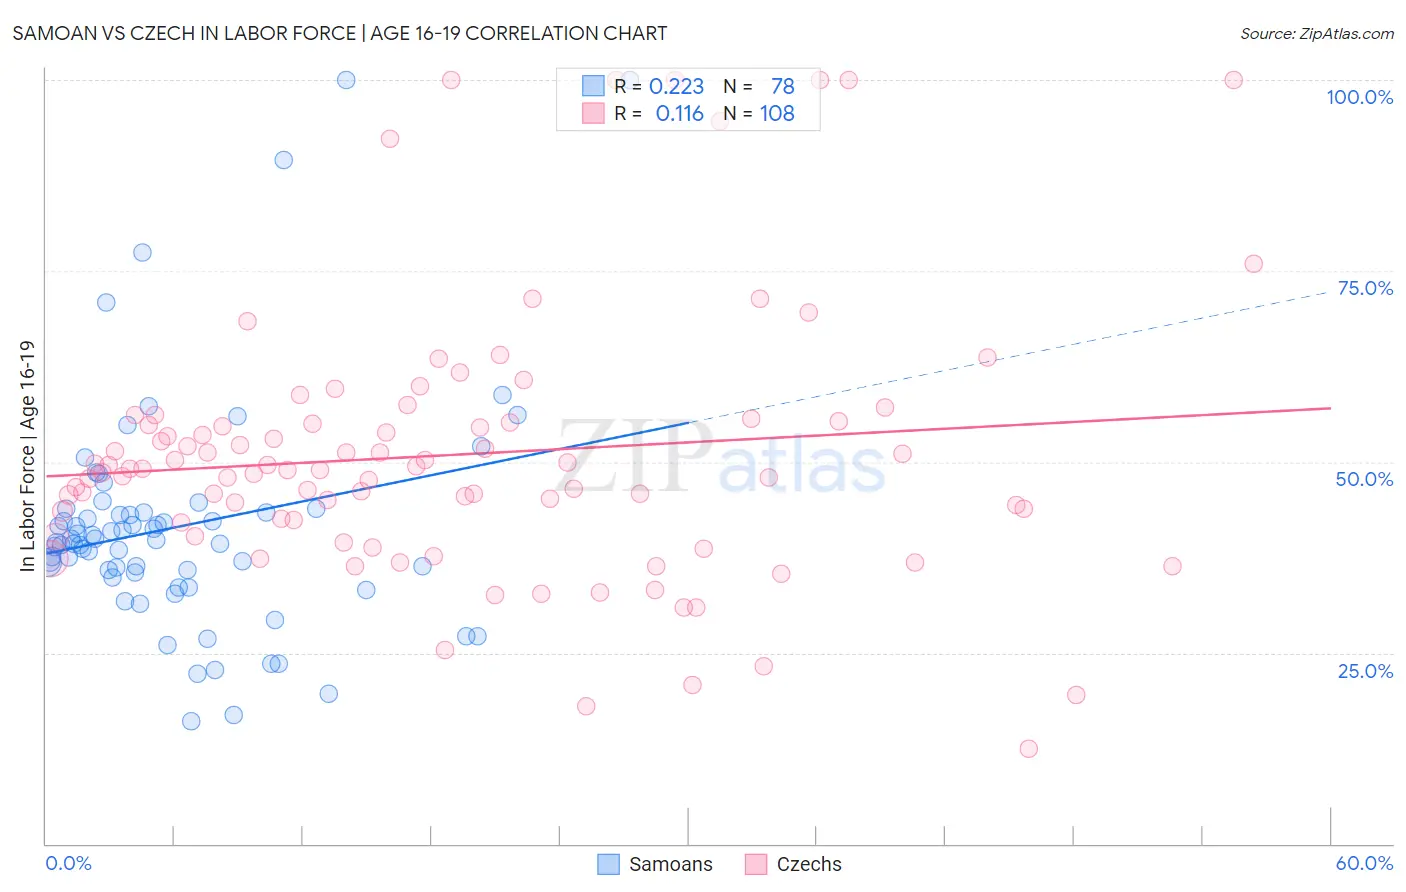
Samoan vs Czech In Labor Force | Age 16-19 Correlation Chart
The statistical analysis conducted on geographies consisting of 225,011,822 people shows a weak positive correlation between the proportion of Samoans and labor force participation rate among population between the ages 16 and 19 in the United States with a correlation coefficient (R) of 0.223 and weighted average of 39.1%. Similarly, the statistical analysis conducted on geographies consisting of 483,278,851 people shows a poor positive correlation between the proportion of Czechs and labor force participation rate among population between the ages 16 and 19 in the United States with a correlation coefficient (R) of 0.116 and weighted average of 43.6%, a difference of 11.5%.
In Labor Force | Age 16-19 Correlation Summary
| Measurement | Samoan | Czech |
| Minimum | 16.0% | 12.5% |
| Maximum | 100.0% | 100.0% |
| Range | 84.0% | 87.5% |
| Mean | 41.6% | 50.9% |
| Median | 39.5% | 49.1% |
| Interquartile 25% (IQ1) | 35.5% | 42.3% |
| Interquartile 75% (IQ3) | 43.3% | 55.2% |
| Interquartile Range (IQR) | 7.9% | 13.0% |
| Standard Deviation (Sample) | 15.2% | 17.5% |
| Standard Deviation (Population) | 15.1% | 17.4% |
Similar Demographics by In Labor Force | Age 16-19
Demographics Similar to Samoans by In Labor Force | Age 16-19
In terms of in labor force | age 16-19, the demographic groups most similar to Samoans are Creek (39.1%, a difference of 0.020%), Immigrants from Germany (39.1%, a difference of 0.080%), Puget Sound Salish (39.1%, a difference of 0.16%), Alaska Native (39.1%, a difference of 0.16%), and Immigrants from Uganda (39.2%, a difference of 0.17%).
| Demographics | Rating | Rank | In Labor Force | Age 16-19 |
| Marshallese | 99.8 /100 | #79 | Exceptional 39.5% |
| Immigrants | Iraq | 99.8 /100 | #80 | Exceptional 39.4% |
| Shoshone | 99.7 /100 | #81 | Exceptional 39.3% |
| Basques | 99.7 /100 | #82 | Exceptional 39.3% |
| Spanish | 99.7 /100 | #83 | Exceptional 39.3% |
| Immigrants | Uganda | 99.7 /100 | #84 | Exceptional 39.2% |
| Creek | 99.6 /100 | #85 | Exceptional 39.1% |
| Samoans | 99.6 /100 | #86 | Exceptional 39.1% |
| Immigrants | Germany | 99.6 /100 | #87 | Exceptional 39.1% |
| Puget Sound Salish | 99.6 /100 | #88 | Exceptional 39.1% |
| Alaska Natives | 99.6 /100 | #89 | Exceptional 39.1% |
| Immigrants | Burma/Myanmar | 99.5 /100 | #90 | Exceptional 39.0% |
| Spanish Americans | 99.5 /100 | #91 | Exceptional 39.0% |
| Osage | 99.4 /100 | #92 | Exceptional 39.0% |
| Blackfeet | 99.4 /100 | #93 | Exceptional 38.9% |
Demographics Similar to Czechs by In Labor Force | Age 16-19
In terms of in labor force | age 16-19, the demographic groups most similar to Czechs are Scandinavian (43.6%, a difference of 0.070%), Slovene (43.7%, a difference of 0.11%), French Canadian (43.6%, a difference of 0.14%), Chippewa (43.8%, a difference of 0.36%), and Dutch (43.8%, a difference of 0.47%).
| Demographics | Rating | Rank | In Labor Force | Age 16-19 |
| Cape Verdeans | 100.0 /100 | #9 | Exceptional 44.5% |
| Germans | 100.0 /100 | #10 | Exceptional 44.2% |
| Swedes | 100.0 /100 | #11 | Exceptional 44.1% |
| Finns | 100.0 /100 | #12 | Exceptional 43.9% |
| Dutch | 100.0 /100 | #13 | Exceptional 43.8% |
| Chippewa | 100.0 /100 | #14 | Exceptional 43.8% |
| Slovenes | 100.0 /100 | #15 | Exceptional 43.7% |
| Czechs | 100.0 /100 | #16 | Exceptional 43.6% |
| Scandinavians | 100.0 /100 | #17 | Exceptional 43.6% |
| French Canadians | 100.0 /100 | #18 | Exceptional 43.6% |
| Belgians | 100.0 /100 | #19 | Exceptional 43.4% |
| Swiss | 100.0 /100 | #20 | Exceptional 43.3% |
| Ottawa | 100.0 /100 | #21 | Exceptional 43.0% |
| Sudanese | 100.0 /100 | #22 | Exceptional 42.9% |
| Slovaks | 100.0 /100 | #23 | Exceptional 42.6% |