Samoan vs Alaska Native Self-Care Disability

COMPARE

Samoan
Race
Ancestry
AfghanAfricanAlaskan AthabascanAlbanianAleutAlsatianAmericanApacheArabArapahoArgentineanArmenianAssyrian/Chaldean/SyriacAustralianAustrianBahamianBangladeshiBarbadianBasqueBelgianBelizeanBermudanBhutaneseBlackfeetBolivianBrazilianBritishBritish West IndianBulgarianBurmeseCajunCambodianCanadianCape VerdeanCarpatho RusynCelticCentral AmericanCentral American IndianCherokeeCheyenneChickasawChileanChineseChippewaChoctawColombianColvilleComancheCosta RicanCreeCreekCroatianCrowCubanCypriotCzechCzechoslovakianDanishDelawareDominicanDutchDutch West IndianEastern EuropeanEcuadorianEgyptianEnglishEstonianEthiopianEuropeanFijianFilipinoFinnishFrenchFrench American IndianFrench CanadianGermanGerman RussianGhanaianGreekGuamanian/ChamorroGuatemalanGuyaneseHaitianHmongHonduranHopiHoumaHungarianIcelanderIndian (Asian)IndonesianInupiatIranianIraqiIrishIroquoisIsraeliItalianJamaicanJapaneseJordanianKenyanKiowaKoreanLaotianLatvianLebaneseLiberianLithuanianLumbeeLuxembourgerMacedonianMalaysianMalteseMarshalleseMenomineeMexicanMexican American IndianMongolianMoroccanNative HawaiianNavajoNepaleseNew ZealanderNicaraguanNigerianNorthern EuropeanNorwegianOkinawanOsageOttawaPaiutePakistaniPalestinianPanamanianParaguayanPennsylvania GermanPeruvianPimaPolishPortuguesePotawatomiPuebloPuerto RicanPuget Sound SalishRomanianRussianSalvadoranSamoanScandinavianScotch-IrishScottishSeminoleSenegaleseSerbianShoshoneSierra LeoneanSiouxSlavicSlovakSloveneSomaliSouth AfricanSouth AmericanSouth American IndianSoviet UnionSpaniardSpanishSpanish AmericanSpanish American IndianSri LankanSubsaharan AfricanSudaneseSwedishSwissSyrianTaiwaneseThaiTlingit-HaidaTohono O'OdhamTonganTrinidadian and TobagonianTsimshianTurkishU.S. Virgin IslanderUgandanUkrainianUruguayanUteVenezuelanVietnameseWelshWest IndianYakamaYaquiYugoslavianYumanYup'ikZimbabwean
Immigration
NonimmigrantsImmigrantsAfghanistanAfricaAlbaniaArgentinaArmeniaAsiaAustraliaAustriaBahamasBangladeshBarbadosBelarusBelgiumBelizeBoliviaBosnia and HerzegovinaBrazilBulgariaBurma/MyanmarCabo VerdeCambodiaCameroonCanadaCaribbeanCentral AmericaChileChinaColombiaCongoCosta RicaCroatiaCubaCzechoslovakiaDenmarkDominicaDominican RepublicEastern AfricaEastern AsiaEastern EuropeEcuadorEgyptEl SalvadorEnglandEritreaEthiopiaEuropeFijiFranceGermanyGhanaGreeceGrenadaGuatemalaGuyanaHaitiHondurasHong KongHungaryIndiaIndonesiaIranIraqIrelandIsraelItalyJamaicaJapanJordanKazakhstanKenyaKoreaKuwaitLaosLatin AmericaLatviaLebanonLiberiaLithuaniaMalaysiaMexicoMicronesiaMiddle AfricaMoldovaMoroccoNepalNetherlandsNicaraguaNigeriaNorth AmericaNorth MacedoniaNorthern AfricaNorthern EuropeNorwayOceaniaPakistanPanamaPeruPhilippinesPolandPortugalRomaniaRussiaSaudi ArabiaScotlandSenegalSerbiaSierra LeoneSingaporeSomaliaSouth AfricaSouth AmericaSouth Central AsiaSouth Eastern AsiaSouthern EuropeSpainSri LankaSt. Vincent and the GrenadinesSudanSwedenSwitzerlandSyriaTaiwanThailandTrinidad and TobagoTurkeyUgandaUkraineUruguayUzbekistanVenezuelaVietnamWest IndiesWestern AfricaWestern AsiaWestern EuropeYemenZaireZimbabweAzores
Alaska Native
Race
Ancestry
AfghanAfricanAlaska NativeAlaskan AthabascanAlbanianAleutAlsatianAmericanApacheArabArapahoArgentineanArmenianAssyrian/Chaldean/SyriacAustralianAustrianBahamianBangladeshiBarbadianBasqueBelgianBelizeanBermudanBhutaneseBlackfeetBolivianBrazilianBritishBritish West IndianBulgarianBurmeseCajunCambodianCanadianCape VerdeanCarpatho RusynCelticCentral AmericanCentral American IndianCherokeeCheyenneChickasawChileanChineseChippewaChoctawColombianColvilleComancheCosta RicanCreeCreekCroatianCrowCubanCypriotCzechCzechoslovakianDanishDelawareDominicanDutchDutch West IndianEastern EuropeanEcuadorianEgyptianEnglishEstonianEthiopianEuropeanFijianFilipinoFinnishFrenchFrench American IndianFrench CanadianGermanGerman RussianGhanaianGreekGuamanian/ChamorroGuatemalanGuyaneseHaitianHmongHonduranHopiHoumaHungarianIcelanderIndian (Asian)IndonesianInupiatIranianIraqiIrishIroquoisIsraeliItalianJamaicanJapaneseJordanianKenyanKiowaKoreanLaotianLatvianLebaneseLiberianLithuanianLumbeeLuxembourgerMacedonianMalaysianMalteseMarshalleseMenomineeMexicanMexican American IndianMongolianMoroccanNative HawaiianNavajoNepaleseNew ZealanderNicaraguanNigerianNorthern EuropeanNorwegianOkinawanOsageOttawaPaiutePakistaniPalestinianPanamanianParaguayanPennsylvania GermanPeruvianPimaPolishPortuguesePotawatomiPuebloPuerto RicanPuget Sound SalishRomanianRussianSalvadoranScandinavianScotch-IrishScottishSeminoleSenegaleseSerbianShoshoneSierra LeoneanSiouxSlavicSlovakSloveneSomaliSouth AfricanSouth AmericanSouth American IndianSoviet UnionSpaniardSpanishSpanish AmericanSpanish American IndianSri LankanSubsaharan AfricanSudaneseSwedishSwissSyrianTaiwaneseThaiTlingit-HaidaTohono O'OdhamTonganTrinidadian and TobagonianTsimshianTurkishU.S. Virgin IslanderUgandanUkrainianUruguayanUteVenezuelanVietnameseWelshWest IndianYakamaYaquiYugoslavianYumanYup'ikZimbabwean
Immigration
NonimmigrantsImmigrantsAfghanistanAfricaAlbaniaArgentinaArmeniaAsiaAustraliaAustriaBahamasBangladeshBarbadosBelarusBelgiumBelizeBoliviaBosnia and HerzegovinaBrazilBulgariaBurma/MyanmarCabo VerdeCambodiaCameroonCanadaCaribbeanCentral AmericaChileChinaColombiaCongoCosta RicaCroatiaCubaCzechoslovakiaDenmarkDominicaDominican RepublicEastern AfricaEastern AsiaEastern EuropeEcuadorEgyptEl SalvadorEnglandEritreaEthiopiaEuropeFijiFranceGermanyGhanaGreeceGrenadaGuatemalaGuyanaHaitiHondurasHong KongHungaryIndiaIndonesiaIranIraqIrelandIsraelItalyJamaicaJapanJordanKazakhstanKenyaKoreaKuwaitLaosLatin AmericaLatviaLebanonLiberiaLithuaniaMalaysiaMexicoMicronesiaMiddle AfricaMoldovaMoroccoNepalNetherlandsNicaraguaNigeriaNorth AmericaNorth MacedoniaNorthern AfricaNorthern EuropeNorwayOceaniaPakistanPanamaPeruPhilippinesPolandPortugalRomaniaRussiaSaudi ArabiaScotlandSenegalSerbiaSierra LeoneSingaporeSomaliaSouth AfricaSouth AmericaSouth Central AsiaSouth Eastern AsiaSouthern EuropeSpainSri LankaSt. Vincent and the GrenadinesSudanSwedenSwitzerlandSyriaTaiwanThailandTrinidad and TobagoTurkeyUgandaUkraineUruguayUzbekistanVenezuelaVietnamWest IndiesWestern AfricaWestern AsiaWestern EuropeYemenZaireZimbabweAzores
Self-Care Disability
Income
Poverty
Unemployment
Labor Participation
Family Structure
Vehicle Availability
Education Level
Disability

Self-Care Disability Comparison

Samoans

Alaska Natives

Tragic
Excellent
2.6%
SELF-CARE DISABILITY
5.1/ 100
METRIC RATING
212th/ 347
METRIC RANK
2.4%
SELF-CARE DISABILITY
84.5/ 100
METRIC RATING
141st/ 347
METRIC RANK

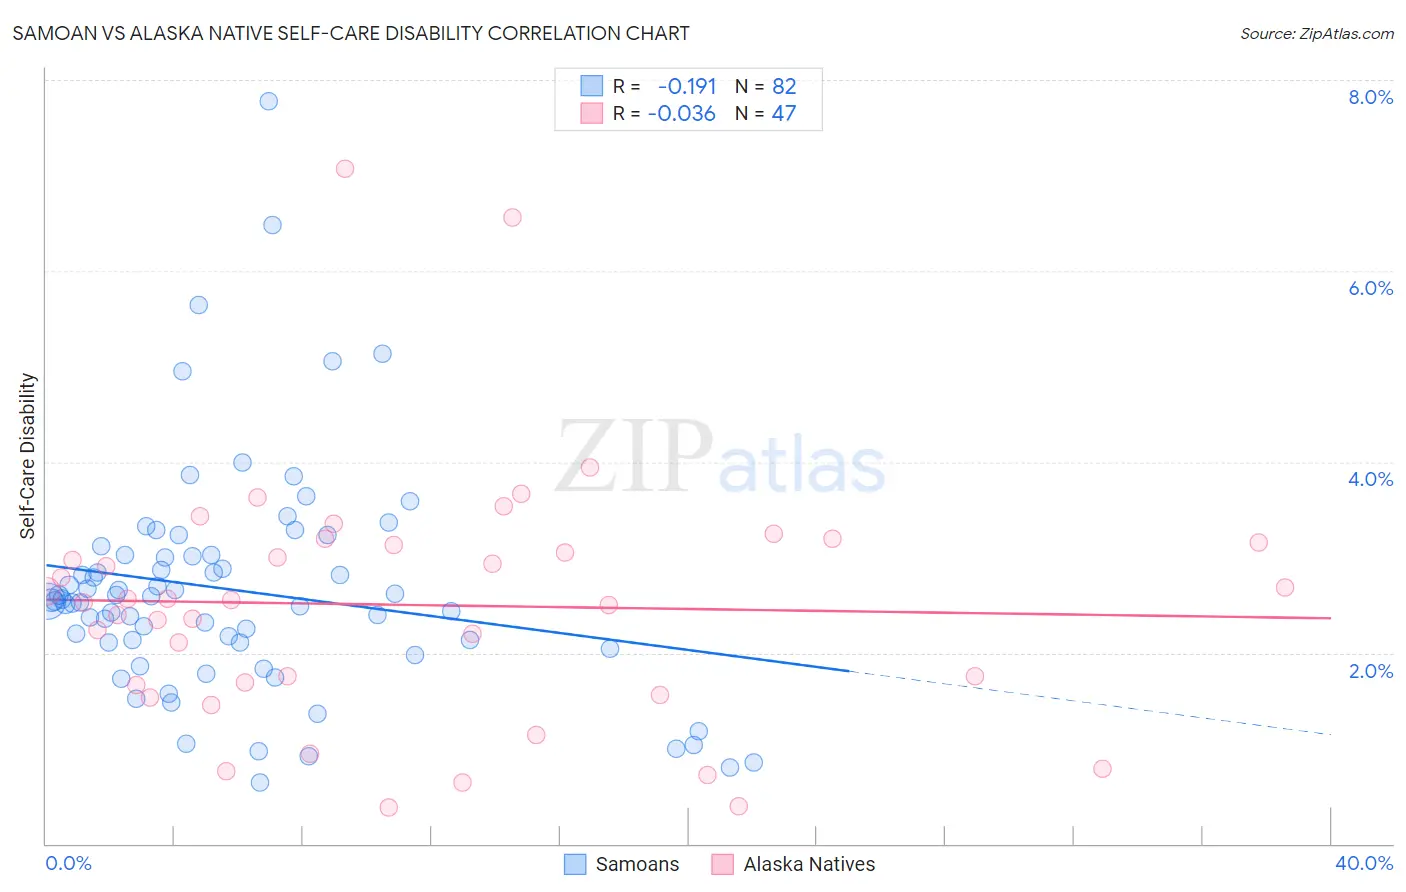
Samoan vs Alaska Native Self-Care Disability Correlation Chart

The statistical analysis conducted on geographies consisting of 224,951,105 people shows a poor negative correlation between the proportion of Samoans and percentage of population with self-care disability in the United States with a correlation coefficient (R) of -0.191 and weighted average of 2.6%. Similarly, the statistical analysis conducted on geographies consisting of 76,706,144 people shows no correlation between the proportion of Alaska Natives and percentage of population with self-care disability in the United States with a correlation coefficient (R) of -0.036 and weighted average of 2.4%, a difference of 5.6%.
Samoan vs Alaska Native Self-Care Disability

Self-Care Disability Correlation Summary

MeasurementSamoanAlaska Native
Minimum0.64%0.38%
Maximum7.8%7.1%
Range7.1%6.7%
Mean2.7%2.5%
Median2.5%2.5%
Interquartile 25% (IQ1)2.1%1.7%
Interquartile 75% (IQ3)3.0%3.2%
Interquartile Range (IQR)0.92%1.5%
Standard Deviation (Sample)1.2%1.3%
Standard Deviation (Population)1.2%1.3%

Similar Demographics by Self-Care Disability

Demographics Similar to Samoans by Self-Care Disability

In terms of self-care disability, the demographic groups most similar to Samoans are Native Hawaiian (2.6%, a difference of 0.020%), Ecuadorian (2.6%, a difference of 0.10%), Immigrants from Honduras (2.6%, a difference of 0.10%), Immigrants from Thailand (2.6%, a difference of 0.14%), and White/Caucasian (2.6%, a difference of 0.17%).
DemographicsRating | RankSelf-Care Disability
Immigrants | Russia
11.0
/100
|
#205
Poor
2.5%
Alaskan Athabascans
10.4
/100
|
#206
Poor
2.5%
French
9.9
/100
|
#207
Tragic
2.5%
Central Americans
8.7
/100
|
#208
Tragic
2.5%
Malaysians
7.7
/100
|
#209
Tragic
2.5%
Panamanians
6.4
/100
|
#210
Tragic
2.5%
Native Hawaiians
5.1
/100
|
#211
Tragic
2.6%
Samoans
5.1
/100
|
#212
Tragic
2.6%
Ecuadorians
4.7
/100
|
#213
Tragic
2.6%
Immigrants | Honduras
4.7
/100
|
#214
Tragic
2.6%
Immigrants | Thailand
4.5
/100
|
#215
Tragic
2.6%
Whites/Caucasians
4.4
/100
|
#216
Tragic
2.6%
Celtics
4.4
/100
|
#217
Tragic
2.6%
Scotch-Irish
4.1
/100
|
#218
Tragic
2.6%
Immigrants | Moldova
4.0
/100
|
#219
Tragic
2.6%

Demographics Similar to Alaska Natives by Self-Care Disability

In terms of self-care disability, the demographic groups most similar to Alaska Natives are Immigrants from Uruguay (2.4%, a difference of 0.090%), Immigrants from Peru (2.4%, a difference of 0.12%), Afghan (2.4%, a difference of 0.19%), Immigrants from Croatia (2.4%, a difference of 0.21%), and Sri Lankan (2.4%, a difference of 0.21%).
DemographicsRating | RankSelf-Care Disability
Russians
88.2
/100
|
#134
Excellent
2.4%
Laotians
87.8
/100
|
#135
Excellent
2.4%
South American Indians
87.2
/100
|
#136
Excellent
2.4%
Austrians
87.0
/100
|
#137
Excellent
2.4%
Immigrants | Croatia
86.6
/100
|
#138
Excellent
2.4%
Sri Lankans
86.6
/100
|
#139
Excellent
2.4%
Immigrants | Uruguay
85.4
/100
|
#140
Excellent
2.4%
Alaska Natives
84.5
/100
|
#141
Excellent
2.4%
Immigrants | Peru
83.2
/100
|
#142
Excellent
2.4%
Afghans
82.3
/100
|
#143
Excellent
2.4%
Costa Ricans
80.8
/100
|
#144
Excellent
2.4%
Germans
80.1
/100
|
#145
Excellent
2.4%
Israelis
80.0
/100
|
#146
Good
2.4%
Dutch
77.5
/100
|
#147
Good
2.4%
Romanians
75.8
/100
|
#148
Good
2.4%