Immigrants from Chile vs Alaska Native Self-Care Disability
COMPARE
Immigrants from Chile
Alaska Native
Self-Care Disability
Self-Care Disability Comparison
Immigrants from Chile
Alaska Natives
2.4%
SELF-CARE DISABILITY
96.7/ 100
METRIC RATING
96th/ 347
METRIC RANK
2.4%
SELF-CARE DISABILITY
84.5/ 100
METRIC RATING
141st/ 347
METRIC RANK
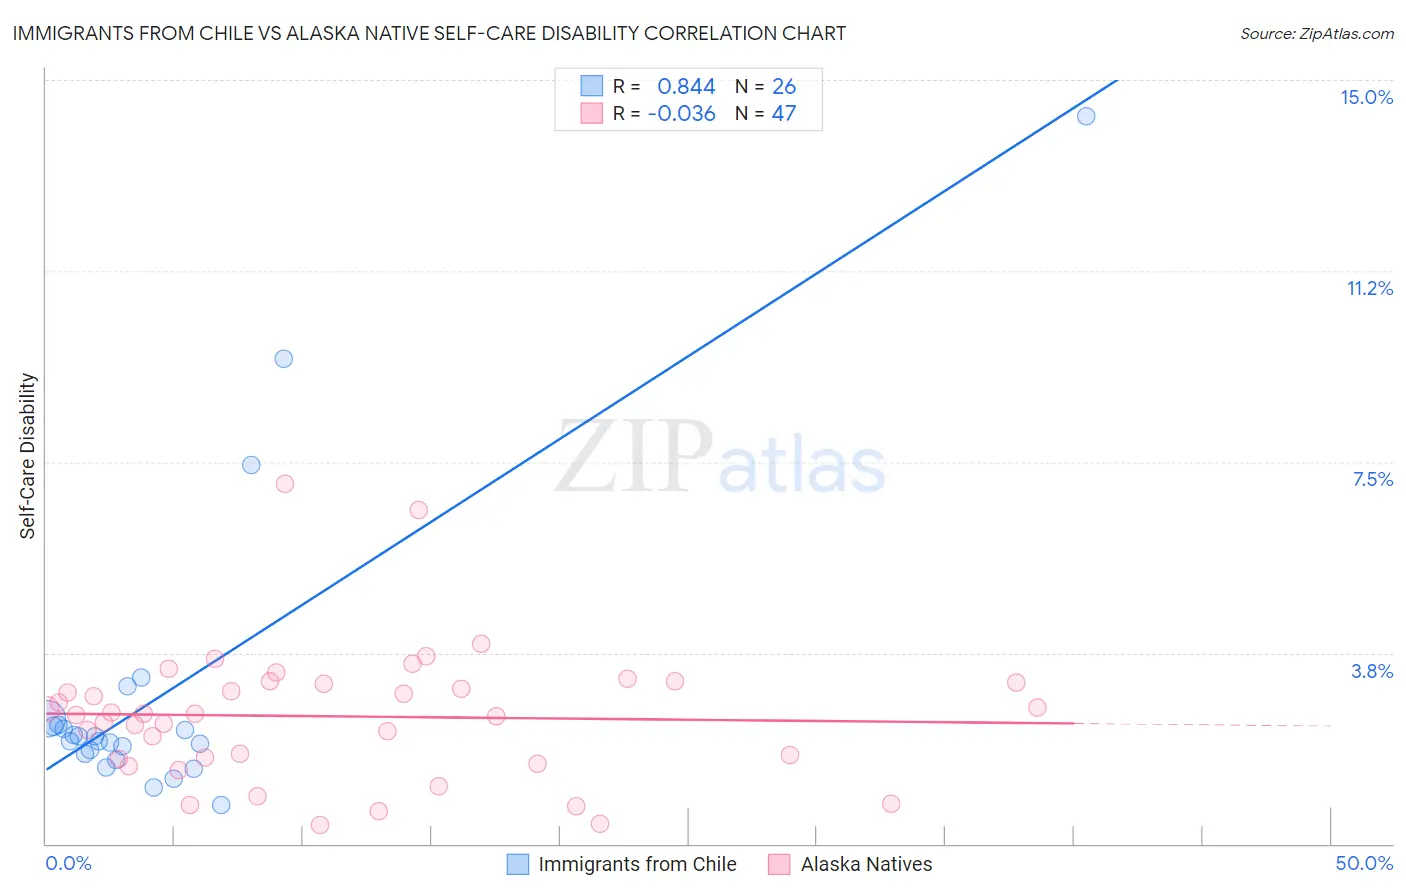
Immigrants from Chile vs Alaska Native Self-Care Disability Correlation Chart
The statistical analysis conducted on geographies consisting of 218,576,088 people shows a very strong positive correlation between the proportion of Immigrants from Chile and percentage of population with self-care disability in the United States with a correlation coefficient (R) of 0.844 and weighted average of 2.4%. Similarly, the statistical analysis conducted on geographies consisting of 76,706,144 people shows no correlation between the proportion of Alaska Natives and percentage of population with self-care disability in the United States with a correlation coefficient (R) of -0.036 and weighted average of 2.4%, a difference of 2.1%.
Self-Care Disability Correlation Summary
| Measurement | Immigrants from Chile | Alaska Native |
| Minimum | 0.76% | 0.38% |
| Maximum | 14.3% | 7.1% |
| Range | 13.5% | 6.7% |
| Mean | 3.0% | 2.5% |
| Median | 2.1% | 2.5% |
| Interquartile 25% (IQ1) | 1.8% | 1.7% |
| Interquartile 75% (IQ3) | 2.3% | 3.2% |
| Interquartile Range (IQR) | 0.58% | 1.5% |
| Standard Deviation (Sample) | 3.0% | 1.3% |
| Standard Deviation (Population) | 2.9% | 1.3% |
Similar Demographics by Self-Care Disability
Demographics Similar to Immigrants from Chile by Self-Care Disability
In terms of self-care disability, the demographic groups most similar to Immigrants from Chile are Swiss (2.4%, a difference of 0.040%), Immigrants from Asia (2.4%, a difference of 0.060%), Macedonian (2.4%, a difference of 0.070%), Immigrants from Latvia (2.4%, a difference of 0.11%), and Immigrants from Poland (2.4%, a difference of 0.14%).
| Demographics | Rating | Rank | Self-Care Disability |
| Immigrants | Congo | 98.0 /100 | #89 | Exceptional 2.4% |
| Immigrants | Czechoslovakia | 97.7 /100 | #90 | Exceptional 2.4% |
| Immigrants | Jordan | 97.7 /100 | #91 | Exceptional 2.4% |
| Icelanders | 97.4 /100 | #92 | Exceptional 2.4% |
| Immigrants | Latvia | 97.0 /100 | #93 | Exceptional 2.4% |
| Macedonians | 96.9 /100 | #94 | Exceptional 2.4% |
| Immigrants | Asia | 96.9 /100 | #95 | Exceptional 2.4% |
| Immigrants | Chile | 96.7 /100 | #96 | Exceptional 2.4% |
| Swiss | 96.6 /100 | #97 | Exceptional 2.4% |
| Immigrants | Poland | 96.4 /100 | #98 | Exceptional 2.4% |
| Immigrants | Israel | 96.1 /100 | #99 | Exceptional 2.4% |
| Europeans | 95.8 /100 | #100 | Exceptional 2.4% |
| Immigrants | Scotland | 95.7 /100 | #101 | Exceptional 2.4% |
| Croatians | 95.0 /100 | #102 | Exceptional 2.4% |
| Alsatians | 94.9 /100 | #103 | Exceptional 2.4% |
Demographics Similar to Alaska Natives by Self-Care Disability
In terms of self-care disability, the demographic groups most similar to Alaska Natives are Immigrants from Uruguay (2.4%, a difference of 0.090%), Immigrants from Peru (2.4%, a difference of 0.12%), Afghan (2.4%, a difference of 0.19%), Immigrants from Croatia (2.4%, a difference of 0.21%), and Sri Lankan (2.4%, a difference of 0.21%).
| Demographics | Rating | Rank | Self-Care Disability |
| Russians | 88.2 /100 | #134 | Excellent 2.4% |
| Laotians | 87.8 /100 | #135 | Excellent 2.4% |
| South American Indians | 87.2 /100 | #136 | Excellent 2.4% |
| Austrians | 87.0 /100 | #137 | Excellent 2.4% |
| Immigrants | Croatia | 86.6 /100 | #138 | Excellent 2.4% |
| Sri Lankans | 86.6 /100 | #139 | Excellent 2.4% |
| Immigrants | Uruguay | 85.4 /100 | #140 | Excellent 2.4% |
| Alaska Natives | 84.5 /100 | #141 | Excellent 2.4% |
| Immigrants | Peru | 83.2 /100 | #142 | Excellent 2.4% |
| Afghans | 82.3 /100 | #143 | Excellent 2.4% |
| Costa Ricans | 80.8 /100 | #144 | Excellent 2.4% |
| Germans | 80.1 /100 | #145 | Excellent 2.4% |
| Israelis | 80.0 /100 | #146 | Good 2.4% |
| Dutch | 77.5 /100 | #147 | Good 2.4% |
| Romanians | 75.8 /100 | #148 | Good 2.4% |