Somali vs Alaska Native Self-Care Disability
COMPARE
Somali
Alaska Native
Self-Care Disability
Self-Care Disability Comparison
Somalis
Alaska Natives
2.5%
SELF-CARE DISABILITY
63.7/ 100
METRIC RATING
162nd/ 347
METRIC RANK
2.4%
SELF-CARE DISABILITY
84.5/ 100
METRIC RATING
141st/ 347
METRIC RANK
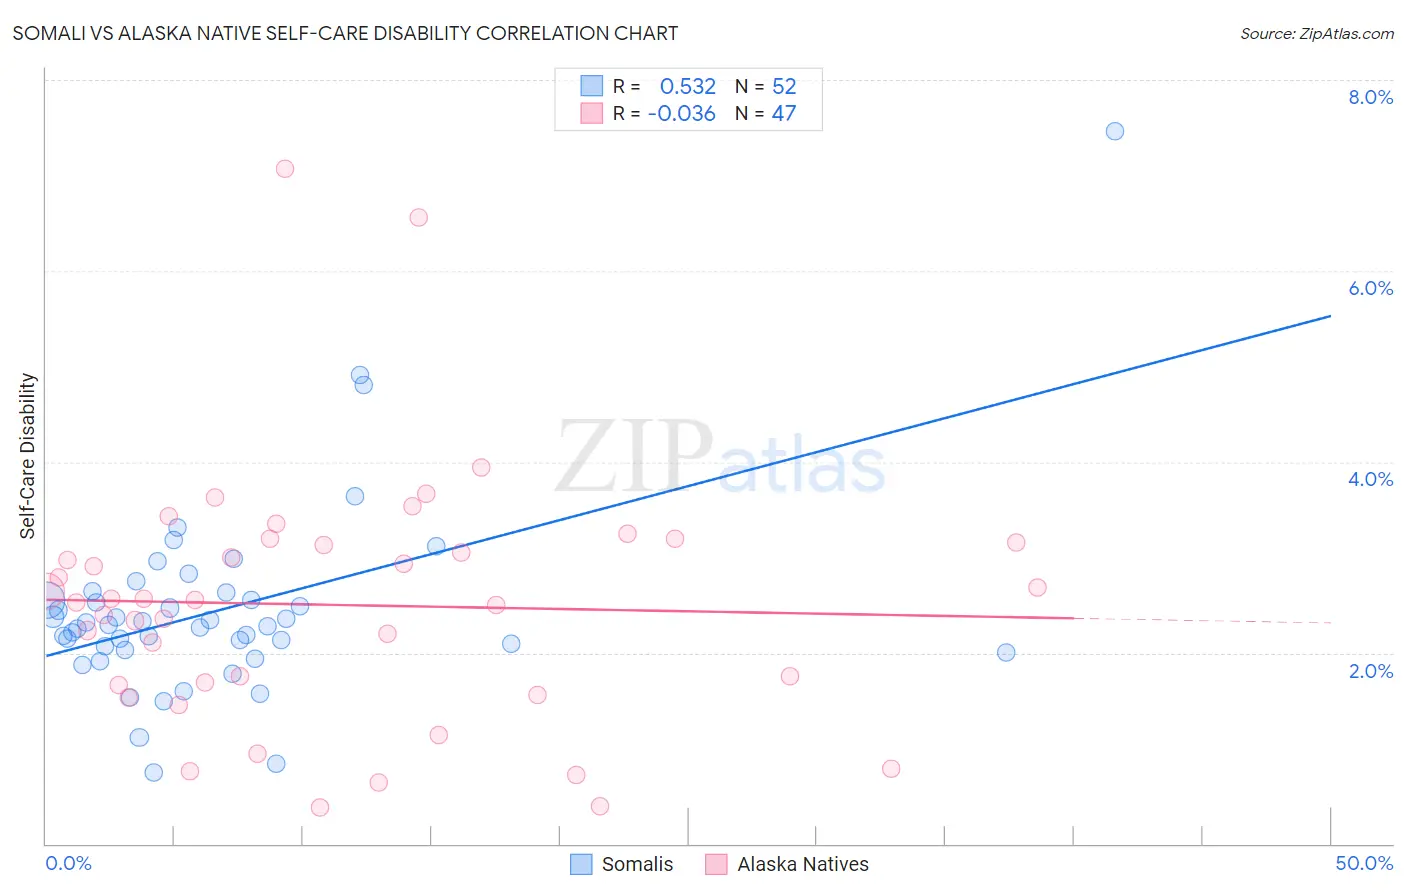
Somali vs Alaska Native Self-Care Disability Correlation Chart
The statistical analysis conducted on geographies consisting of 99,258,512 people shows a substantial positive correlation between the proportion of Somalis and percentage of population with self-care disability in the United States with a correlation coefficient (R) of 0.532 and weighted average of 2.5%. Similarly, the statistical analysis conducted on geographies consisting of 76,706,144 people shows no correlation between the proportion of Alaska Natives and percentage of population with self-care disability in the United States with a correlation coefficient (R) of -0.036 and weighted average of 2.4%, a difference of 1.4%.
Self-Care Disability Correlation Summary
| Measurement | Somali | Alaska Native |
| Minimum | 0.74% | 0.38% |
| Maximum | 7.5% | 7.1% |
| Range | 6.7% | 6.7% |
| Mean | 2.4% | 2.5% |
| Median | 2.3% | 2.5% |
| Interquartile 25% (IQ1) | 2.0% | 1.7% |
| Interquartile 75% (IQ3) | 2.6% | 3.2% |
| Interquartile Range (IQR) | 0.54% | 1.5% |
| Standard Deviation (Sample) | 1.0% | 1.3% |
| Standard Deviation (Population) | 1.0% | 1.3% |
Similar Demographics by Self-Care Disability
Demographics Similar to Somalis by Self-Care Disability
In terms of self-care disability, the demographic groups most similar to Somalis are German Russian (2.5%, a difference of 0.050%), Lebanese (2.4%, a difference of 0.14%), Finnish (2.4%, a difference of 0.17%), Immigrants from Vietnam (2.5%, a difference of 0.23%), and Syrian (2.5%, a difference of 0.24%).
| Demographics | Rating | Rank | Self-Care Disability |
| Pakistanis | 71.4 /100 | #155 | Good 2.4% |
| Nigerians | 70.6 /100 | #156 | Good 2.4% |
| Immigrants | Europe | 69.6 /100 | #157 | Good 2.4% |
| Immigrants | Western Europe | 68.6 /100 | #158 | Good 2.4% |
| Immigrants | Italy | 68.5 /100 | #159 | Good 2.4% |
| Finns | 67.0 /100 | #160 | Good 2.4% |
| Lebanese | 66.5 /100 | #161 | Good 2.4% |
| Somalis | 63.7 /100 | #162 | Good 2.5% |
| German Russians | 62.7 /100 | #163 | Good 2.5% |
| Immigrants | Vietnam | 59.3 /100 | #164 | Average 2.5% |
| Syrians | 59.0 /100 | #165 | Average 2.5% |
| Canadians | 58.8 /100 | #166 | Average 2.5% |
| Immigrants | Greece | 57.3 /100 | #167 | Average 2.5% |
| Ute | 57.1 /100 | #168 | Average 2.5% |
| Immigrants | Somalia | 55.9 /100 | #169 | Average 2.5% |
Demographics Similar to Alaska Natives by Self-Care Disability
In terms of self-care disability, the demographic groups most similar to Alaska Natives are Immigrants from Uruguay (2.4%, a difference of 0.090%), Immigrants from Peru (2.4%, a difference of 0.12%), Afghan (2.4%, a difference of 0.19%), Immigrants from Croatia (2.4%, a difference of 0.21%), and Sri Lankan (2.4%, a difference of 0.21%).
| Demographics | Rating | Rank | Self-Care Disability |
| Russians | 88.2 /100 | #134 | Excellent 2.4% |
| Laotians | 87.8 /100 | #135 | Excellent 2.4% |
| South American Indians | 87.2 /100 | #136 | Excellent 2.4% |
| Austrians | 87.0 /100 | #137 | Excellent 2.4% |
| Immigrants | Croatia | 86.6 /100 | #138 | Excellent 2.4% |
| Sri Lankans | 86.6 /100 | #139 | Excellent 2.4% |
| Immigrants | Uruguay | 85.4 /100 | #140 | Excellent 2.4% |
| Alaska Natives | 84.5 /100 | #141 | Excellent 2.4% |
| Immigrants | Peru | 83.2 /100 | #142 | Excellent 2.4% |
| Afghans | 82.3 /100 | #143 | Excellent 2.4% |
| Costa Ricans | 80.8 /100 | #144 | Excellent 2.4% |
| Germans | 80.1 /100 | #145 | Excellent 2.4% |
| Israelis | 80.0 /100 | #146 | Good 2.4% |
| Dutch | 77.5 /100 | #147 | Good 2.4% |
| Romanians | 75.8 /100 | #148 | Good 2.4% |