Immigrants from Kazakhstan vs Alaska Native Self-Care Disability

COMPARE

Immigrants from Kazakhstan
Race
Ancestry
AfghanAfricanAlaskan AthabascanAlbanianAleutAlsatianAmericanApacheArabArapahoArgentineanArmenianAssyrian/Chaldean/SyriacAustralianAustrianBahamianBangladeshiBarbadianBasqueBelgianBelizeanBermudanBhutaneseBlackfeetBolivianBrazilianBritishBritish West IndianBulgarianBurmeseCajunCambodianCanadianCape VerdeanCarpatho RusynCelticCentral AmericanCentral American IndianCherokeeCheyenneChickasawChileanChineseChippewaChoctawColombianColvilleComancheCosta RicanCreeCreekCroatianCrowCubanCypriotCzechCzechoslovakianDanishDelawareDominicanDutchDutch West IndianEastern EuropeanEcuadorianEgyptianEnglishEstonianEthiopianEuropeanFijianFilipinoFinnishFrenchFrench American IndianFrench CanadianGermanGerman RussianGhanaianGreekGuamanian/ChamorroGuatemalanGuyaneseHaitianHmongHonduranHopiHoumaHungarianIcelanderIndian (Asian)IndonesianInupiatIranianIraqiIrishIroquoisIsraeliItalianJamaicanJapaneseJordanianKenyanKiowaKoreanLaotianLatvianLebaneseLiberianLithuanianLumbeeLuxembourgerMacedonianMalaysianMalteseMarshalleseMenomineeMexicanMexican American IndianMongolianMoroccanNative HawaiianNavajoNepaleseNew ZealanderNicaraguanNigerianNorthern EuropeanNorwegianOkinawanOsageOttawaPaiutePakistaniPalestinianPanamanianParaguayanPennsylvania GermanPeruvianPimaPolishPortuguesePotawatomiPuebloPuerto RicanPuget Sound SalishRomanianRussianSalvadoranSamoanScandinavianScotch-IrishScottishSeminoleSenegaleseSerbianShoshoneSierra LeoneanSiouxSlavicSlovakSloveneSomaliSouth AfricanSouth AmericanSouth American IndianSoviet UnionSpaniardSpanishSpanish AmericanSpanish American IndianSri LankanSubsaharan AfricanSudaneseSwedishSwissSyrianTaiwaneseThaiTlingit-HaidaTohono O'OdhamTonganTrinidadian and TobagonianTsimshianTurkishU.S. Virgin IslanderUgandanUkrainianUruguayanUteVenezuelanVietnameseWelshWest IndianYakamaYaquiYugoslavianYumanYup'ikZimbabwean
Immigration
NonimmigrantsImmigrantsAfghanistanAfricaAlbaniaArgentinaArmeniaAsiaAustraliaAustriaBahamasBangladeshBarbadosBelarusBelgiumBelizeBoliviaBosnia and HerzegovinaBrazilBulgariaBurma/MyanmarCabo VerdeCambodiaCameroonCanadaCaribbeanCentral AmericaChileChinaColombiaCongoCosta RicaCroatiaCubaCzechoslovakiaDenmarkDominicaDominican RepublicEastern AfricaEastern AsiaEastern EuropeEcuadorEgyptEl SalvadorEnglandEritreaEthiopiaEuropeFijiFranceGermanyGhanaGreeceGrenadaGuatemalaGuyanaHaitiHondurasHong KongHungaryIndiaIndonesiaIranIraqIrelandIsraelItalyJamaicaJapanJordanKazakhstanKenyaKoreaKuwaitLaosLatin AmericaLatviaLebanonLiberiaLithuaniaMalaysiaMexicoMicronesiaMiddle AfricaMoldovaMoroccoNepalNetherlandsNicaraguaNigeriaNorth AmericaNorth MacedoniaNorthern AfricaNorthern EuropeNorwayOceaniaPakistanPanamaPeruPhilippinesPolandPortugalRomaniaRussiaSaudi ArabiaScotlandSenegalSerbiaSierra LeoneSingaporeSomaliaSouth AfricaSouth AmericaSouth Central AsiaSouth Eastern AsiaSouthern EuropeSpainSri LankaSt. Vincent and the GrenadinesSudanSwedenSwitzerlandSyriaTaiwanThailandTrinidad and TobagoTurkeyUgandaUkraineUruguayUzbekistanVenezuelaVietnamWest IndiesWestern AfricaWestern AsiaWestern EuropeYemenZaireZimbabweAzores
Alaska Native
Race
Ancestry
AfghanAfricanAlaska NativeAlaskan AthabascanAlbanianAleutAlsatianAmericanApacheArabArapahoArgentineanArmenianAssyrian/Chaldean/SyriacAustralianAustrianBahamianBangladeshiBarbadianBasqueBelgianBelizeanBermudanBhutaneseBlackfeetBolivianBrazilianBritishBritish West IndianBulgarianBurmeseCajunCambodianCanadianCape VerdeanCarpatho RusynCelticCentral AmericanCentral American IndianCherokeeCheyenneChickasawChileanChineseChippewaChoctawColombianColvilleComancheCosta RicanCreeCreekCroatianCrowCubanCypriotCzechCzechoslovakianDanishDelawareDominicanDutchDutch West IndianEastern EuropeanEcuadorianEgyptianEnglishEstonianEthiopianEuropeanFijianFilipinoFinnishFrenchFrench American IndianFrench CanadianGermanGerman RussianGhanaianGreekGuamanian/ChamorroGuatemalanGuyaneseHaitianHmongHonduranHopiHoumaHungarianIcelanderIndian (Asian)IndonesianInupiatIranianIraqiIrishIroquoisIsraeliItalianJamaicanJapaneseJordanianKenyanKiowaKoreanLaotianLatvianLebaneseLiberianLithuanianLumbeeLuxembourgerMacedonianMalaysianMalteseMarshalleseMenomineeMexicanMexican American IndianMongolianMoroccanNative HawaiianNavajoNepaleseNew ZealanderNicaraguanNigerianNorthern EuropeanNorwegianOkinawanOsageOttawaPaiutePakistaniPalestinianPanamanianParaguayanPennsylvania GermanPeruvianPimaPolishPortuguesePotawatomiPuebloPuerto RicanPuget Sound SalishRomanianRussianSalvadoranSamoanScandinavianScotch-IrishScottishSeminoleSenegaleseSerbianShoshoneSierra LeoneanSiouxSlavicSlovakSloveneSomaliSouth AfricanSouth AmericanSouth American IndianSoviet UnionSpaniardSpanishSpanish AmericanSpanish American IndianSri LankanSubsaharan AfricanSudaneseSwedishSwissSyrianTaiwaneseThaiTlingit-HaidaTohono O'OdhamTonganTrinidadian and TobagonianTsimshianTurkishU.S. Virgin IslanderUgandanUkrainianUruguayanUteVenezuelanVietnameseWelshWest IndianYakamaYaquiYugoslavianYumanYup'ikZimbabwean
Immigration
NonimmigrantsImmigrantsAfghanistanAfricaAlbaniaArgentinaArmeniaAsiaAustraliaAustriaBahamasBangladeshBarbadosBelarusBelgiumBelizeBoliviaBosnia and HerzegovinaBrazilBulgariaBurma/MyanmarCabo VerdeCambodiaCameroonCanadaCaribbeanCentral AmericaChileChinaColombiaCongoCosta RicaCroatiaCubaCzechoslovakiaDenmarkDominicaDominican RepublicEastern AfricaEastern AsiaEastern EuropeEcuadorEgyptEl SalvadorEnglandEritreaEthiopiaEuropeFijiFranceGermanyGhanaGreeceGrenadaGuatemalaGuyanaHaitiHondurasHong KongHungaryIndiaIndonesiaIranIraqIrelandIsraelItalyJamaicaJapanJordanKenyaKoreaKuwaitLaosLatin AmericaLatviaLebanonLiberiaLithuaniaMalaysiaMexicoMicronesiaMiddle AfricaMoldovaMoroccoNepalNetherlandsNicaraguaNigeriaNorth AmericaNorth MacedoniaNorthern AfricaNorthern EuropeNorwayOceaniaPakistanPanamaPeruPhilippinesPolandPortugalRomaniaRussiaSaudi ArabiaScotlandSenegalSerbiaSierra LeoneSingaporeSomaliaSouth AfricaSouth AmericaSouth Central AsiaSouth Eastern AsiaSouthern EuropeSpainSri LankaSt. Vincent and the GrenadinesSudanSwedenSwitzerlandSyriaTaiwanThailandTrinidad and TobagoTurkeyUgandaUkraineUruguayUzbekistanVenezuelaVietnamWest IndiesWestern AfricaWestern AsiaWestern EuropeYemenZaireZimbabweAzores
Self-Care Disability
Income
Poverty
Unemployment
Labor Participation
Family Structure
Vehicle Availability
Education Level
Disability

Self-Care Disability Comparison

Immigrants from Kazakhstan

Alaska Natives

Average
Excellent
2.5%
SELF-CARE DISABILITY
46.7/ 100
METRIC RATING
177th/ 347
METRIC RANK
2.4%
SELF-CARE DISABILITY
84.5/ 100
METRIC RATING
141st/ 347
METRIC RANK

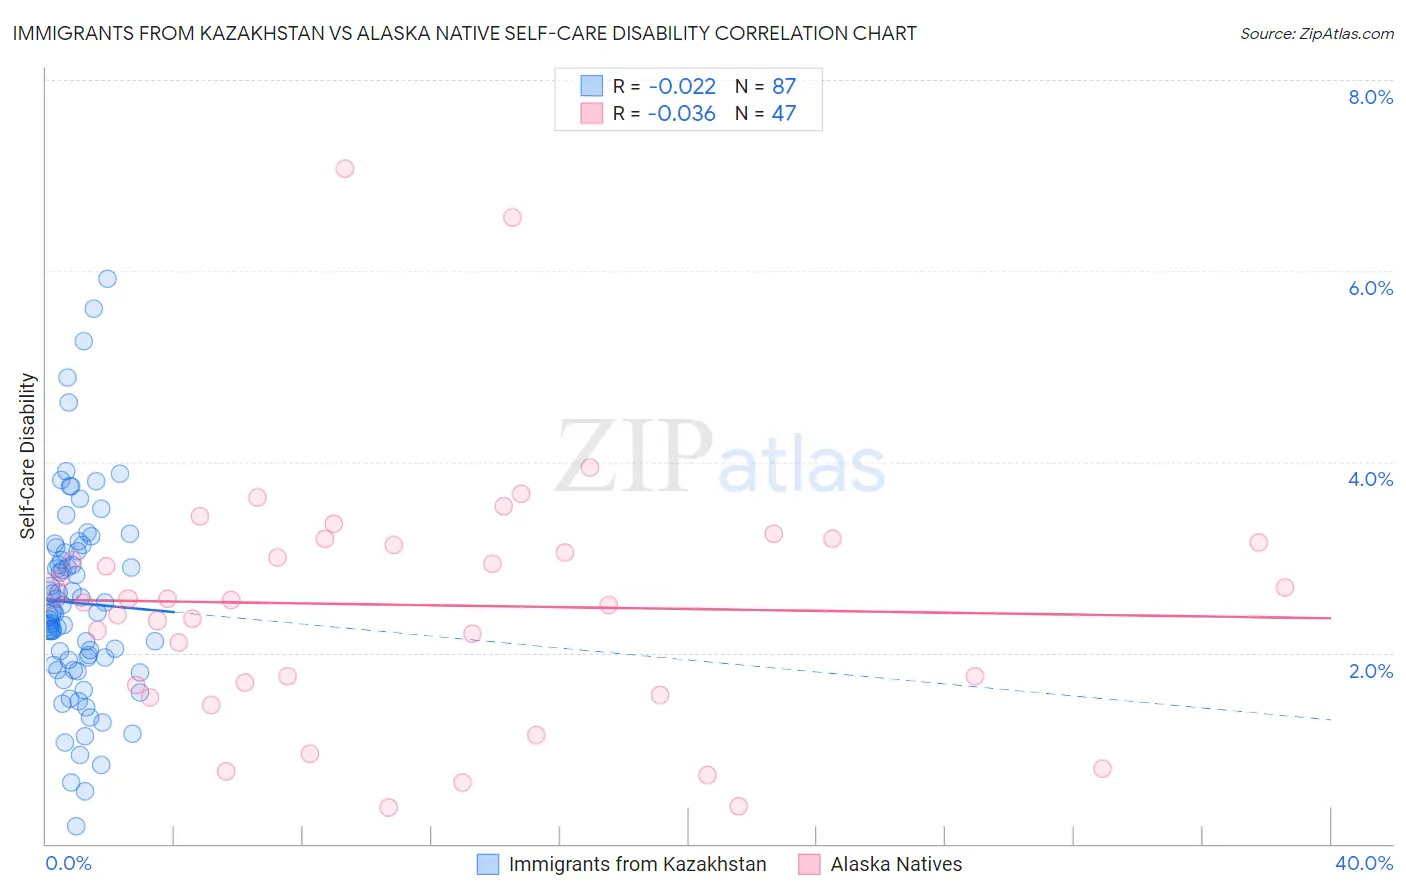
Immigrants from Kazakhstan vs Alaska Native Self-Care Disability Correlation Chart

The statistical analysis conducted on geographies consisting of 124,334,513 people shows no correlation between the proportion of Immigrants from Kazakhstan and percentage of population with self-care disability in the United States with a correlation coefficient (R) of -0.022 and weighted average of 2.5%. Similarly, the statistical analysis conducted on geographies consisting of 76,706,144 people shows no correlation between the proportion of Alaska Natives and percentage of population with self-care disability in the United States with a correlation coefficient (R) of -0.036 and weighted average of 2.4%, a difference of 2.2%.
Immigrants from Kazakhstan vs Alaska Native Self-Care Disability

Self-Care Disability Correlation Summary

MeasurementImmigrants from KazakhstanAlaska Native
Minimum0.18%0.38%
Maximum5.9%7.1%
Range5.7%6.7%
Mean2.5%2.5%
Median2.4%2.5%
Interquartile 25% (IQ1)1.9%1.7%
Interquartile 75% (IQ3)3.1%3.2%
Interquartile Range (IQR)1.2%1.5%
Standard Deviation (Sample)1.1%1.3%
Standard Deviation (Population)1.1%1.3%

Similar Demographics by Self-Care Disability

Demographics Similar to Immigrants from Kazakhstan by Self-Care Disability

In terms of self-care disability, the demographic groups most similar to Immigrants from Kazakhstan are English (2.5%, a difference of 0.020%), Immigrants from Afghanistan (2.5%, a difference of 0.040%), Hungarian (2.5%, a difference of 0.060%), Immigrants from Bosnia and Herzegovina (2.5%, a difference of 0.14%), and Welsh (2.5%, a difference of 0.16%).
DemographicsRating | RankSelf-Care Disability
Scottish
54.3
/100
|
#170
Average
2.5%
Pennsylvania Germans
53.5
/100
|
#171
Average
2.5%
Czechoslovakians
53.5
/100
|
#172
Average
2.5%
Immigrants | Burma/Myanmar
52.8
/100
|
#173
Average
2.5%
Welsh
50.0
/100
|
#174
Average
2.5%
Immigrants | Bosnia and Herzegovina
49.6
/100
|
#175
Average
2.5%
Immigrants | Afghanistan
47.6
/100
|
#176
Average
2.5%
Immigrants | Kazakhstan
46.7
/100
|
#177
Average
2.5%
English
46.2
/100
|
#178
Average
2.5%
Hungarians
45.5
/100
|
#179
Average
2.5%
Indonesians
41.2
/100
|
#180
Average
2.5%
Ghanaians
40.4
/100
|
#181
Average
2.5%
Maltese
37.5
/100
|
#182
Fair
2.5%
Salvadorans
36.4
/100
|
#183
Fair
2.5%
Yugoslavians
36.1
/100
|
#184
Fair
2.5%

Demographics Similar to Alaska Natives by Self-Care Disability

In terms of self-care disability, the demographic groups most similar to Alaska Natives are Immigrants from Uruguay (2.4%, a difference of 0.090%), Immigrants from Peru (2.4%, a difference of 0.12%), Afghan (2.4%, a difference of 0.19%), Immigrants from Croatia (2.4%, a difference of 0.21%), and Sri Lankan (2.4%, a difference of 0.21%).
DemographicsRating | RankSelf-Care Disability
Russians
88.2
/100
|
#134
Excellent
2.4%
Laotians
87.8
/100
|
#135
Excellent
2.4%
South American Indians
87.2
/100
|
#136
Excellent
2.4%
Austrians
87.0
/100
|
#137
Excellent
2.4%
Immigrants | Croatia
86.6
/100
|
#138
Excellent
2.4%
Sri Lankans
86.6
/100
|
#139
Excellent
2.4%
Immigrants | Uruguay
85.4
/100
|
#140
Excellent
2.4%
Alaska Natives
84.5
/100
|
#141
Excellent
2.4%
Immigrants | Peru
83.2
/100
|
#142
Excellent
2.4%
Afghans
82.3
/100
|
#143
Excellent
2.4%
Costa Ricans
80.8
/100
|
#144
Excellent
2.4%
Germans
80.1
/100
|
#145
Excellent
2.4%
Israelis
80.0
/100
|
#146
Good
2.4%
Dutch
77.5
/100
|
#147
Good
2.4%
Romanians
75.8
/100
|
#148
Good
2.4%