Samoan vs British Self-Care Disability
COMPARE
Samoan
British
Self-Care Disability
Self-Care Disability Comparison
Samoans
British
2.6%
SELF-CARE DISABILITY
5.1/ 100
METRIC RATING
212th/ 347
METRIC RANK
2.4%
SELF-CARE DISABILITY
94.3/ 100
METRIC RATING
107th/ 347
METRIC RANK
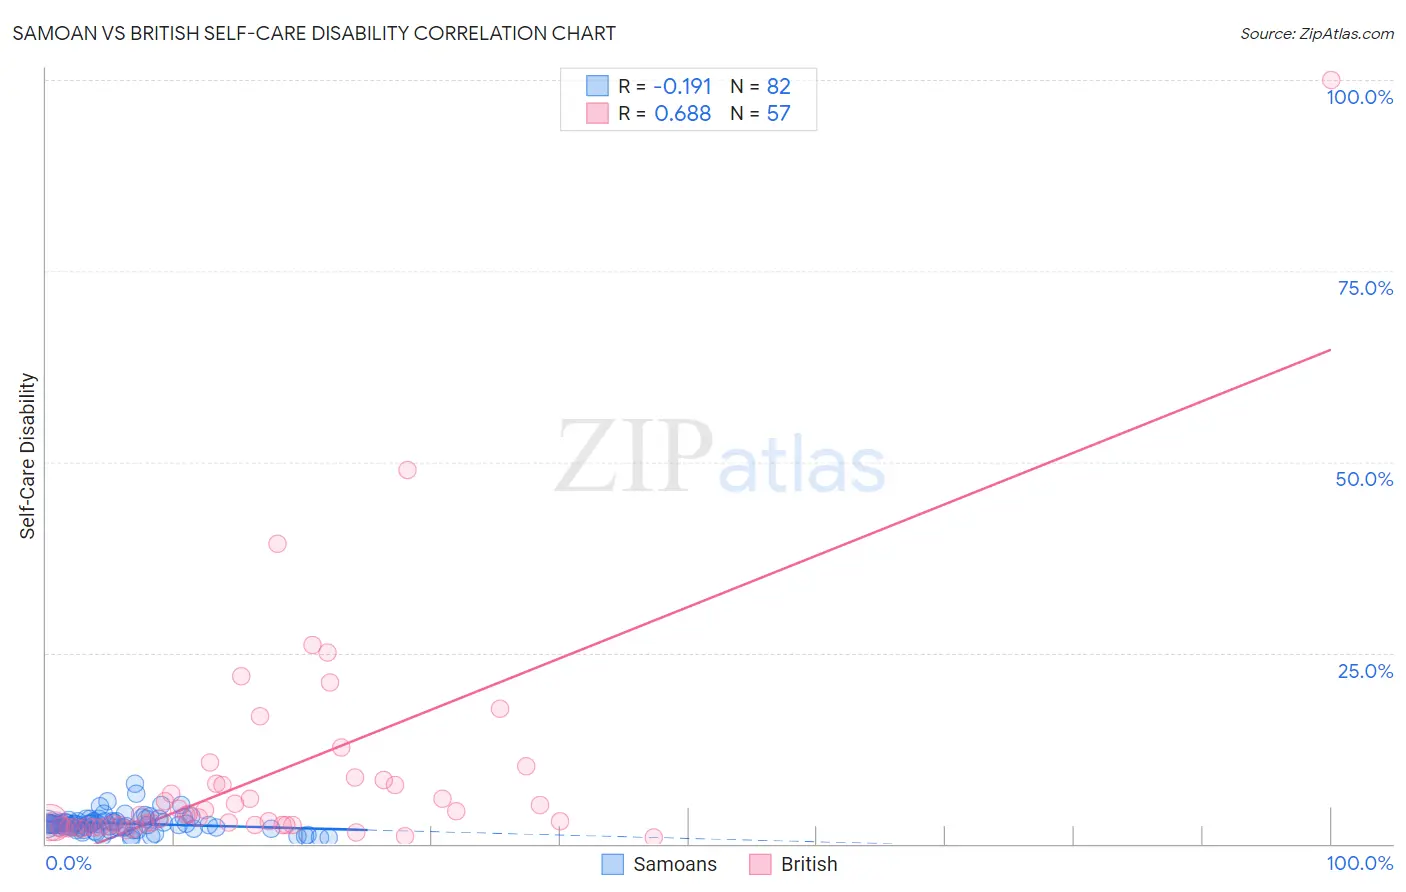
Samoan vs British Self-Care Disability Correlation Chart
The statistical analysis conducted on geographies consisting of 224,951,105 people shows a poor negative correlation between the proportion of Samoans and percentage of population with self-care disability in the United States with a correlation coefficient (R) of -0.191 and weighted average of 2.6%. Similarly, the statistical analysis conducted on geographies consisting of 530,052,811 people shows a significant positive correlation between the proportion of British and percentage of population with self-care disability in the United States with a correlation coefficient (R) of 0.688 and weighted average of 2.4%, a difference of 7.0%.
Self-Care Disability Correlation Summary
| Measurement | Samoan | British |
| Minimum | 0.64% | 0.87% |
| Maximum | 7.8% | 100.0% |
| Range | 7.1% | 99.1% |
| Mean | 2.7% | 9.0% |
| Median | 2.5% | 3.7% |
| Interquartile 25% (IQ1) | 2.1% | 2.4% |
| Interquartile 75% (IQ3) | 3.0% | 8.0% |
| Interquartile Range (IQR) | 0.92% | 5.6% |
| Standard Deviation (Sample) | 1.2% | 15.4% |
| Standard Deviation (Population) | 1.2% | 15.3% |
Similar Demographics by Self-Care Disability
Demographics Similar to Samoans by Self-Care Disability
In terms of self-care disability, the demographic groups most similar to Samoans are Native Hawaiian (2.6%, a difference of 0.020%), Ecuadorian (2.6%, a difference of 0.10%), Immigrants from Honduras (2.6%, a difference of 0.10%), Immigrants from Thailand (2.6%, a difference of 0.14%), and White/Caucasian (2.6%, a difference of 0.17%).
| Demographics | Rating | Rank | Self-Care Disability |
| Immigrants | Russia | 11.0 /100 | #205 | Poor 2.5% |
| Alaskan Athabascans | 10.4 /100 | #206 | Poor 2.5% |
| French | 9.9 /100 | #207 | Tragic 2.5% |
| Central Americans | 8.7 /100 | #208 | Tragic 2.5% |
| Malaysians | 7.7 /100 | #209 | Tragic 2.5% |
| Panamanians | 6.4 /100 | #210 | Tragic 2.5% |
| Native Hawaiians | 5.1 /100 | #211 | Tragic 2.6% |
| Samoans | 5.1 /100 | #212 | Tragic 2.6% |
| Ecuadorians | 4.7 /100 | #213 | Tragic 2.6% |
| Immigrants | Honduras | 4.7 /100 | #214 | Tragic 2.6% |
| Immigrants | Thailand | 4.5 /100 | #215 | Tragic 2.6% |
| Whites/Caucasians | 4.4 /100 | #216 | Tragic 2.6% |
| Celtics | 4.4 /100 | #217 | Tragic 2.6% |
| Scotch-Irish | 4.1 /100 | #218 | Tragic 2.6% |
| Immigrants | Moldova | 4.0 /100 | #219 | Tragic 2.6% |
Demographics Similar to British by Self-Care Disability
In terms of self-care disability, the demographic groups most similar to British are Immigrants from Indonesia (2.4%, a difference of 0.010%), Carpatho Rusyn (2.4%, a difference of 0.020%), Greek (2.4%, a difference of 0.030%), Slovene (2.4%, a difference of 0.040%), and Bhutanese (2.4%, a difference of 0.050%).
| Demographics | Rating | Rank | Self-Care Disability |
| Europeans | 95.8 /100 | #100 | Exceptional 2.4% |
| Immigrants | Scotland | 95.7 /100 | #101 | Exceptional 2.4% |
| Croatians | 95.0 /100 | #102 | Exceptional 2.4% |
| Alsatians | 94.9 /100 | #103 | Exceptional 2.4% |
| Bhutanese | 94.5 /100 | #104 | Exceptional 2.4% |
| Carpatho Rusyns | 94.4 /100 | #105 | Exceptional 2.4% |
| Immigrants | Indonesia | 94.3 /100 | #106 | Exceptional 2.4% |
| British | 94.3 /100 | #107 | Exceptional 2.4% |
| Greeks | 94.1 /100 | #108 | Exceptional 2.4% |
| Slovenes | 94.1 /100 | #109 | Exceptional 2.4% |
| Immigrants | Africa | 93.7 /100 | #110 | Exceptional 2.4% |
| Serbians | 93.6 /100 | #111 | Exceptional 2.4% |
| Scandinavians | 93.5 /100 | #112 | Exceptional 2.4% |
| South Americans | 93.2 /100 | #113 | Exceptional 2.4% |
| Immigrants | North Macedonia | 93.1 /100 | #114 | Exceptional 2.4% |