Samoan vs Liberian Self-Care Disability
COMPARE
Samoan
Liberian
Self-Care Disability
Self-Care Disability Comparison
Samoans
Liberians
2.6%
SELF-CARE DISABILITY
5.1/ 100
METRIC RATING
212th/ 347
METRIC RANK
2.6%
SELF-CARE DISABILITY
2.1/ 100
METRIC RATING
233rd/ 347
METRIC RANK
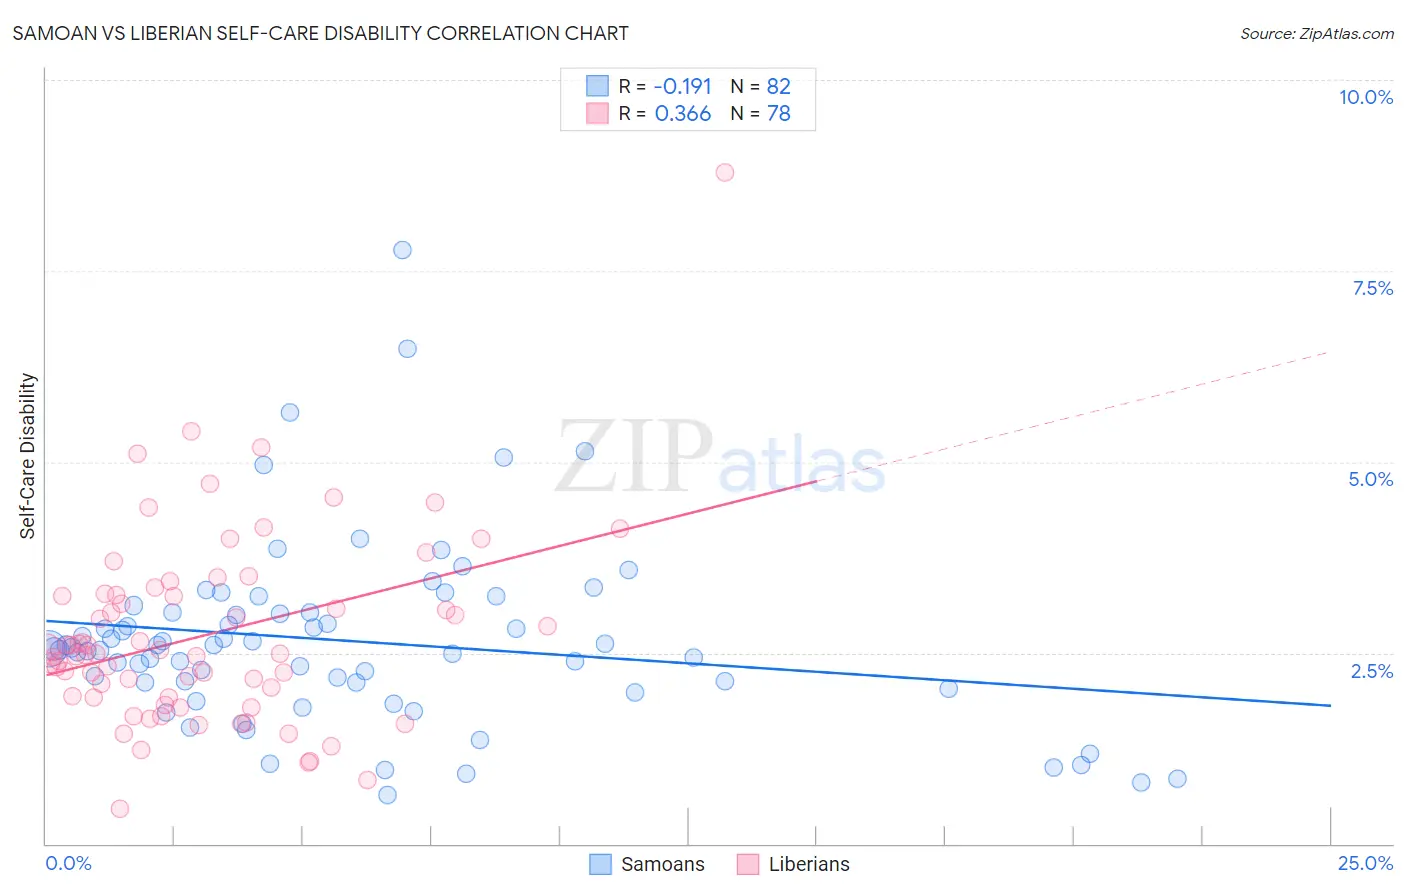
Samoan vs Liberian Self-Care Disability Correlation Chart
The statistical analysis conducted on geographies consisting of 224,951,105 people shows a poor negative correlation between the proportion of Samoans and percentage of population with self-care disability in the United States with a correlation coefficient (R) of -0.191 and weighted average of 2.6%. Similarly, the statistical analysis conducted on geographies consisting of 117,995,885 people shows a mild positive correlation between the proportion of Liberians and percentage of population with self-care disability in the United States with a correlation coefficient (R) of 0.366 and weighted average of 2.6%, a difference of 1.1%.
Self-Care Disability Correlation Summary
| Measurement | Samoan | Liberian |
| Minimum | 0.64% | 0.46% |
| Maximum | 7.8% | 8.8% |
| Range | 7.1% | 8.3% |
| Mean | 2.7% | 2.7% |
| Median | 2.5% | 2.5% |
| Interquartile 25% (IQ1) | 2.1% | 1.9% |
| Interquartile 75% (IQ3) | 3.0% | 3.2% |
| Interquartile Range (IQR) | 0.92% | 1.3% |
| Standard Deviation (Sample) | 1.2% | 1.3% |
| Standard Deviation (Population) | 1.2% | 1.2% |
Similar Demographics by Self-Care Disability
Demographics Similar to Samoans by Self-Care Disability
In terms of self-care disability, the demographic groups most similar to Samoans are Native Hawaiian (2.6%, a difference of 0.020%), Ecuadorian (2.6%, a difference of 0.10%), Immigrants from Honduras (2.6%, a difference of 0.10%), Immigrants from Thailand (2.6%, a difference of 0.14%), and White/Caucasian (2.6%, a difference of 0.17%).
| Demographics | Rating | Rank | Self-Care Disability |
| Immigrants | Russia | 11.0 /100 | #205 | Poor 2.5% |
| Alaskan Athabascans | 10.4 /100 | #206 | Poor 2.5% |
| French | 9.9 /100 | #207 | Tragic 2.5% |
| Central Americans | 8.7 /100 | #208 | Tragic 2.5% |
| Malaysians | 7.7 /100 | #209 | Tragic 2.5% |
| Panamanians | 6.4 /100 | #210 | Tragic 2.5% |
| Native Hawaiians | 5.1 /100 | #211 | Tragic 2.6% |
| Samoans | 5.1 /100 | #212 | Tragic 2.6% |
| Ecuadorians | 4.7 /100 | #213 | Tragic 2.6% |
| Immigrants | Honduras | 4.7 /100 | #214 | Tragic 2.6% |
| Immigrants | Thailand | 4.5 /100 | #215 | Tragic 2.6% |
| Whites/Caucasians | 4.4 /100 | #216 | Tragic 2.6% |
| Celtics | 4.4 /100 | #217 | Tragic 2.6% |
| Scotch-Irish | 4.1 /100 | #218 | Tragic 2.6% |
| Immigrants | Moldova | 4.0 /100 | #219 | Tragic 2.6% |
Demographics Similar to Liberians by Self-Care Disability
In terms of self-care disability, the demographic groups most similar to Liberians are Vietnamese (2.6%, a difference of 0.010%), Albanian (2.6%, a difference of 0.040%), Bahamian (2.6%, a difference of 0.040%), Immigrants from Guatemala (2.6%, a difference of 0.070%), and Bermudan (2.6%, a difference of 0.11%).
| Demographics | Rating | Rank | Self-Care Disability |
| Chinese | 2.9 /100 | #226 | Tragic 2.6% |
| Immigrants | Philippines | 2.7 /100 | #227 | Tragic 2.6% |
| Guatemalans | 2.7 /100 | #228 | Tragic 2.6% |
| Guamanians/Chamorros | 2.5 /100 | #229 | Tragic 2.6% |
| Immigrants | Ecuador | 2.5 /100 | #230 | Tragic 2.6% |
| Immigrants | Guatemala | 2.2 /100 | #231 | Tragic 2.6% |
| Albanians | 2.2 /100 | #232 | Tragic 2.6% |
| Liberians | 2.1 /100 | #233 | Tragic 2.6% |
| Vietnamese | 2.1 /100 | #234 | Tragic 2.6% |
| Bahamians | 2.0 /100 | #235 | Tragic 2.6% |
| Bermudans | 1.9 /100 | #236 | Tragic 2.6% |
| Immigrants | Senegal | 1.6 /100 | #237 | Tragic 2.6% |
| Senegalese | 1.3 /100 | #238 | Tragic 2.6% |
| Immigrants | Panama | 1.2 /100 | #239 | Tragic 2.6% |
| Marshallese | 1.2 /100 | #240 | Tragic 2.6% |