Samoan vs Immigrants from Ecuador Self-Care Disability
COMPARE
Samoan
Immigrants from Ecuador
Self-Care Disability
Self-Care Disability Comparison
Samoans
Immigrants from Ecuador
2.6%
SELF-CARE DISABILITY
5.1/ 100
METRIC RATING
212th/ 347
METRIC RANK
2.6%
SELF-CARE DISABILITY
2.5/ 100
METRIC RATING
230th/ 347
METRIC RANK
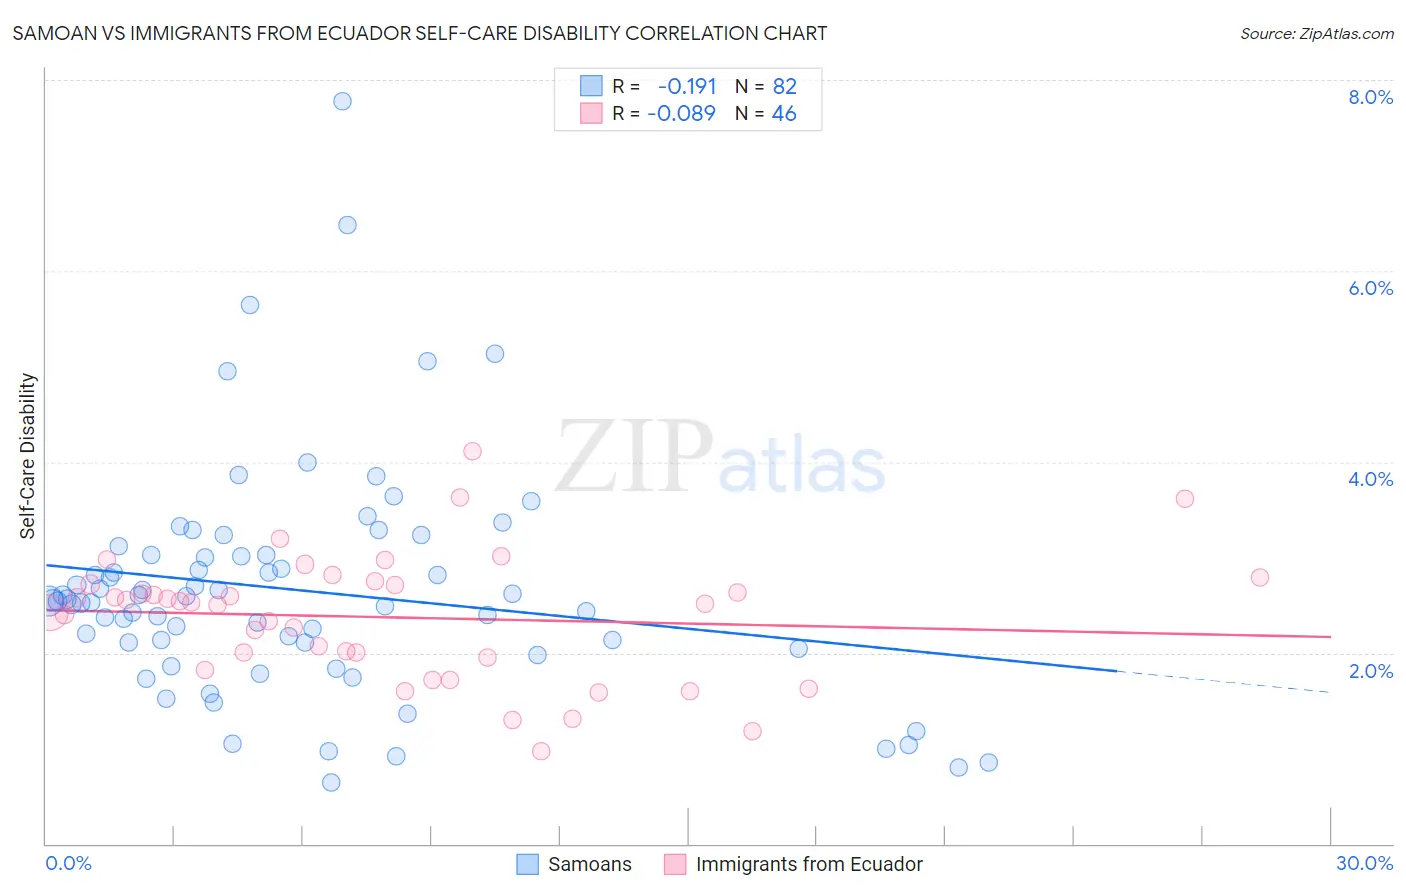
Samoan vs Immigrants from Ecuador Self-Care Disability Correlation Chart
The statistical analysis conducted on geographies consisting of 224,951,105 people shows a poor negative correlation between the proportion of Samoans and percentage of population with self-care disability in the United States with a correlation coefficient (R) of -0.191 and weighted average of 2.6%. Similarly, the statistical analysis conducted on geographies consisting of 270,835,557 people shows a slight negative correlation between the proportion of Immigrants from Ecuador and percentage of population with self-care disability in the United States with a correlation coefficient (R) of -0.089 and weighted average of 2.6%, a difference of 0.84%.
Self-Care Disability Correlation Summary
| Measurement | Samoan | Immigrants from Ecuador |
| Minimum | 0.64% | 0.96% |
| Maximum | 7.8% | 4.1% |
| Range | 7.1% | 3.1% |
| Mean | 2.7% | 2.4% |
| Median | 2.5% | 2.5% |
| Interquartile 25% (IQ1) | 2.1% | 2.0% |
| Interquartile 75% (IQ3) | 3.0% | 2.7% |
| Interquartile Range (IQR) | 0.92% | 0.76% |
| Standard Deviation (Sample) | 1.2% | 0.66% |
| Standard Deviation (Population) | 1.2% | 0.65% |
Demographics Similar to Samoans and Immigrants from Ecuador by Self-Care Disability
In terms of self-care disability, the demographic groups most similar to Samoans are Native Hawaiian (2.6%, a difference of 0.020%), Ecuadorian (2.6%, a difference of 0.10%), Immigrants from Honduras (2.6%, a difference of 0.10%), Immigrants from Thailand (2.6%, a difference of 0.14%), and White/Caucasian (2.6%, a difference of 0.17%). Similarly, the demographic groups most similar to Immigrants from Ecuador are Guamanian/Chamorro (2.6%, a difference of 0.010%), Immigrants from Philippines (2.6%, a difference of 0.080%), Guatemalan (2.6%, a difference of 0.080%), Immigrants from Guatemala (2.6%, a difference of 0.15%), and Chinese (2.6%, a difference of 0.16%).
| Demographics | Rating | Rank | Self-Care Disability |
| Native Hawaiians | 5.1 /100 | #211 | Tragic 2.6% |
| Samoans | 5.1 /100 | #212 | Tragic 2.6% |
| Ecuadorians | 4.7 /100 | #213 | Tragic 2.6% |
| Immigrants | Honduras | 4.7 /100 | #214 | Tragic 2.6% |
| Immigrants | Thailand | 4.5 /100 | #215 | Tragic 2.6% |
| Whites/Caucasians | 4.4 /100 | #216 | Tragic 2.6% |
| Celtics | 4.4 /100 | #217 | Tragic 2.6% |
| Scotch-Irish | 4.1 /100 | #218 | Tragic 2.6% |
| Immigrants | Moldova | 4.0 /100 | #219 | Tragic 2.6% |
| Sub-Saharan Africans | 4.0 /100 | #220 | Tragic 2.6% |
| Hondurans | 3.8 /100 | #221 | Tragic 2.6% |
| Spaniards | 3.8 /100 | #222 | Tragic 2.6% |
| French Canadians | 3.8 /100 | #223 | Tragic 2.6% |
| Osage | 3.6 /100 | #224 | Tragic 2.6% |
| Iraqis | 3.2 /100 | #225 | Tragic 2.6% |
| Chinese | 2.9 /100 | #226 | Tragic 2.6% |
| Immigrants | Philippines | 2.7 /100 | #227 | Tragic 2.6% |
| Guatemalans | 2.7 /100 | #228 | Tragic 2.6% |
| Guamanians/Chamorros | 2.5 /100 | #229 | Tragic 2.6% |
| Immigrants | Ecuador | 2.5 /100 | #230 | Tragic 2.6% |
| Immigrants | Guatemala | 2.2 /100 | #231 | Tragic 2.6% |