Potawatomi vs Inupiat Disability
COMPARE
Potawatomi
Inupiat
Disability
Disability Comparison
Potawatomi
Inupiat
14.2%
DISABILITY
0.0/ 100
METRIC RATING
329th/ 347
METRIC RANK
12.2%
DISABILITY
2.8/ 100
METRIC RATING
229th/ 347
METRIC RANK
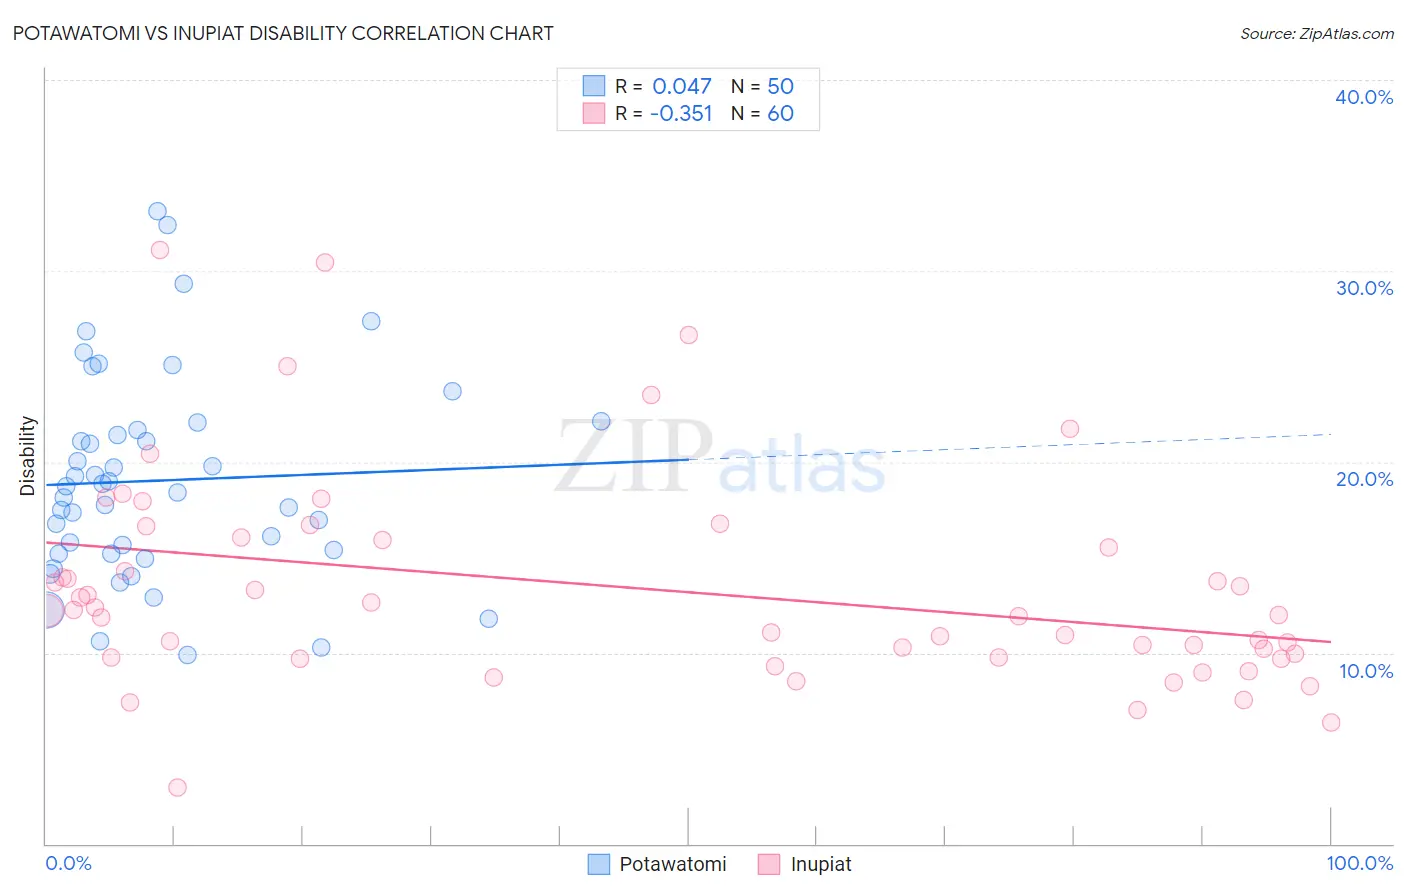
Potawatomi vs Inupiat Disability Correlation Chart
The statistical analysis conducted on geographies consisting of 117,767,457 people shows no correlation between the proportion of Potawatomi and percentage of population with a disability in the United States with a correlation coefficient (R) of 0.047 and weighted average of 14.2%. Similarly, the statistical analysis conducted on geographies consisting of 96,338,624 people shows a mild negative correlation between the proportion of Inupiat and percentage of population with a disability in the United States with a correlation coefficient (R) of -0.351 and weighted average of 12.2%, a difference of 16.6%.
Disability Correlation Summary
| Measurement | Potawatomi | Inupiat |
| Minimum | 9.9% | 2.9% |
| Maximum | 33.1% | 31.1% |
| Range | 23.2% | 28.2% |
| Mean | 19.0% | 13.4% |
| Median | 18.5% | 12.1% |
| Interquartile 25% (IQ1) | 15.2% | 9.8% |
| Interquartile 75% (IQ3) | 21.7% | 16.0% |
| Interquartile Range (IQR) | 6.5% | 6.2% |
| Standard Deviation (Sample) | 5.4% | 5.6% |
| Standard Deviation (Population) | 5.3% | 5.6% |
Similar Demographics by Disability
Demographics Similar to Potawatomi by Disability
In terms of disability, the demographic groups most similar to Potawatomi are Ottawa (14.2%, a difference of 0.12%), Immigrants from the Azores (14.2%, a difference of 0.12%), Osage (14.2%, a difference of 0.14%), Native/Alaskan (14.2%, a difference of 0.17%), and Chippewa (14.1%, a difference of 0.22%).
| Demographics | Rating | Rank | Disability |
| Americans | 0.0 /100 | #322 | Tragic 13.9% |
| Comanche | 0.0 /100 | #323 | Tragic 14.1% |
| Chippewa | 0.0 /100 | #324 | Tragic 14.1% |
| Natives/Alaskans | 0.0 /100 | #325 | Tragic 14.2% |
| Osage | 0.0 /100 | #326 | Tragic 14.2% |
| Ottawa | 0.0 /100 | #327 | Tragic 14.2% |
| Immigrants | Azores | 0.0 /100 | #328 | Tragic 14.2% |
| Potawatomi | 0.0 /100 | #329 | Tragic 14.2% |
| Navajo | 0.0 /100 | #330 | Tragic 14.3% |
| Alaskan Athabascans | 0.0 /100 | #331 | Tragic 14.4% |
| Pueblo | 0.0 /100 | #332 | Tragic 14.4% |
| Cajuns | 0.0 /100 | #333 | Tragic 14.6% |
| Yuman | 0.0 /100 | #334 | Tragic 14.6% |
| Tohono O'odham | 0.0 /100 | #335 | Tragic 14.8% |
| Cherokee | 0.0 /100 | #336 | Tragic 14.8% |
Demographics Similar to Inupiat by Disability
In terms of disability, the demographic groups most similar to Inupiat are West Indian (12.2%, a difference of 0.020%), Samoan (12.2%, a difference of 0.080%), Malaysian (12.2%, a difference of 0.11%), Italian (12.2%, a difference of 0.12%), and Alsatian (12.1%, a difference of 0.16%).
| Demographics | Rating | Rank | Disability |
| Spanish American Indians | 4.1 /100 | #222 | Tragic 12.1% |
| Hispanics or Latinos | 3.9 /100 | #223 | Tragic 12.1% |
| Mexicans | 3.7 /100 | #224 | Tragic 12.1% |
| Senegalese | 3.5 /100 | #225 | Tragic 12.1% |
| Jamaicans | 3.3 /100 | #226 | Tragic 12.1% |
| Alsatians | 3.3 /100 | #227 | Tragic 12.1% |
| West Indians | 2.9 /100 | #228 | Tragic 12.2% |
| Inupiat | 2.8 /100 | #229 | Tragic 12.2% |
| Samoans | 2.6 /100 | #230 | Tragic 12.2% |
| Malaysians | 2.5 /100 | #231 | Tragic 12.2% |
| Italians | 2.5 /100 | #232 | Tragic 12.2% |
| Bahamians | 2.3 /100 | #233 | Tragic 12.2% |
| Japanese | 2.3 /100 | #234 | Tragic 12.2% |
| Yup'ik | 2.2 /100 | #235 | Tragic 12.2% |
| Chinese | 2.0 /100 | #236 | Tragic 12.2% |