Canadian vs Inupiat Disability
COMPARE
Canadian
Inupiat
Disability
Disability Comparison
Canadians
Inupiat
12.4%
DISABILITY
0.4/ 100
METRIC RATING
259th/ 347
METRIC RANK
12.2%
DISABILITY
2.8/ 100
METRIC RATING
229th/ 347
METRIC RANK
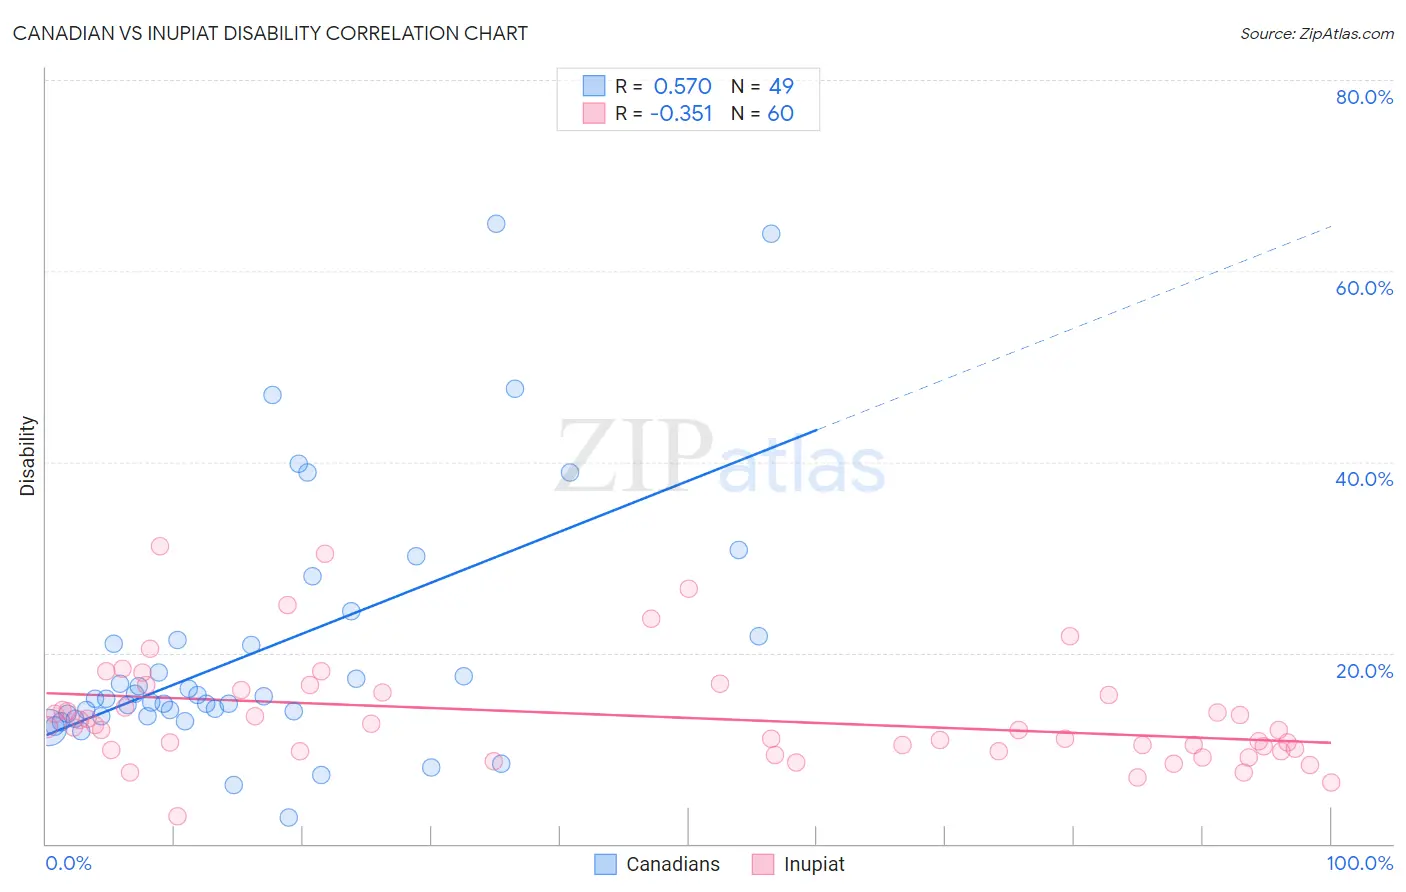
Canadian vs Inupiat Disability Correlation Chart
The statistical analysis conducted on geographies consisting of 437,501,505 people shows a substantial positive correlation between the proportion of Canadians and percentage of population with a disability in the United States with a correlation coefficient (R) of 0.570 and weighted average of 12.4%. Similarly, the statistical analysis conducted on geographies consisting of 96,338,624 people shows a mild negative correlation between the proportion of Inupiat and percentage of population with a disability in the United States with a correlation coefficient (R) of -0.351 and weighted average of 12.2%, a difference of 2.0%.
Disability Correlation Summary
| Measurement | Canadian | Inupiat |
| Minimum | 2.8% | 2.9% |
| Maximum | 65.0% | 31.1% |
| Range | 62.2% | 28.2% |
| Mean | 20.3% | 13.4% |
| Median | 15.2% | 12.1% |
| Interquartile 25% (IQ1) | 13.4% | 9.8% |
| Interquartile 75% (IQ3) | 21.6% | 16.0% |
| Interquartile Range (IQR) | 8.2% | 6.2% |
| Standard Deviation (Sample) | 13.5% | 5.6% |
| Standard Deviation (Population) | 13.3% | 5.6% |
Similar Demographics by Disability
Demographics Similar to Canadians by Disability
In terms of disability, the demographic groups most similar to Canadians are Immigrants from Liberia (12.4%, a difference of 0.030%), Slavic (12.4%, a difference of 0.060%), Scandinavian (12.4%, a difference of 0.10%), Immigrants from Laos (12.4%, a difference of 0.20%), and Immigrants from Dominica (12.4%, a difference of 0.29%).
| Demographics | Rating | Rank | Disability |
| Bermudans | 1.1 /100 | #252 | Tragic 12.3% |
| Belgians | 0.8 /100 | #253 | Tragic 12.3% |
| German Russians | 0.8 /100 | #254 | Tragic 12.3% |
| Slovenes | 0.6 /100 | #255 | Tragic 12.4% |
| Immigrants | Dominica | 0.6 /100 | #256 | Tragic 12.4% |
| Immigrants | Laos | 0.5 /100 | #257 | Tragic 12.4% |
| Slavs | 0.5 /100 | #258 | Tragic 12.4% |
| Canadians | 0.4 /100 | #259 | Tragic 12.4% |
| Immigrants | Liberia | 0.4 /100 | #260 | Tragic 12.4% |
| Scandinavians | 0.4 /100 | #261 | Tragic 12.4% |
| Native Hawaiians | 0.3 /100 | #262 | Tragic 12.5% |
| Hawaiians | 0.2 /100 | #263 | Tragic 12.5% |
| Immigrants | Germany | 0.2 /100 | #264 | Tragic 12.5% |
| U.S. Virgin Islanders | 0.2 /100 | #265 | Tragic 12.5% |
| Czechoslovakians | 0.2 /100 | #266 | Tragic 12.5% |
Demographics Similar to Inupiat by Disability
In terms of disability, the demographic groups most similar to Inupiat are West Indian (12.2%, a difference of 0.020%), Samoan (12.2%, a difference of 0.080%), Malaysian (12.2%, a difference of 0.11%), Italian (12.2%, a difference of 0.12%), and Alsatian (12.1%, a difference of 0.16%).
| Demographics | Rating | Rank | Disability |
| Spanish American Indians | 4.1 /100 | #222 | Tragic 12.1% |
| Hispanics or Latinos | 3.9 /100 | #223 | Tragic 12.1% |
| Mexicans | 3.7 /100 | #224 | Tragic 12.1% |
| Senegalese | 3.5 /100 | #225 | Tragic 12.1% |
| Jamaicans | 3.3 /100 | #226 | Tragic 12.1% |
| Alsatians | 3.3 /100 | #227 | Tragic 12.1% |
| West Indians | 2.9 /100 | #228 | Tragic 12.2% |
| Inupiat | 2.8 /100 | #229 | Tragic 12.2% |
| Samoans | 2.6 /100 | #230 | Tragic 12.2% |
| Malaysians | 2.5 /100 | #231 | Tragic 12.2% |
| Italians | 2.5 /100 | #232 | Tragic 12.2% |
| Bahamians | 2.3 /100 | #233 | Tragic 12.2% |
| Japanese | 2.3 /100 | #234 | Tragic 12.2% |
| Yup'ik | 2.2 /100 | #235 | Tragic 12.2% |
| Chinese | 2.0 /100 | #236 | Tragic 12.2% |