Immigrants from Yemen vs Inupiat Disability
COMPARE
Immigrants from Yemen
Inupiat
Disability
Disability Comparison
Immigrants from Yemen
Inupiat
12.6%
DISABILITY
0.1/ 100
METRIC RATING
271st/ 347
METRIC RANK
12.2%
DISABILITY
2.8/ 100
METRIC RATING
229th/ 347
METRIC RANK
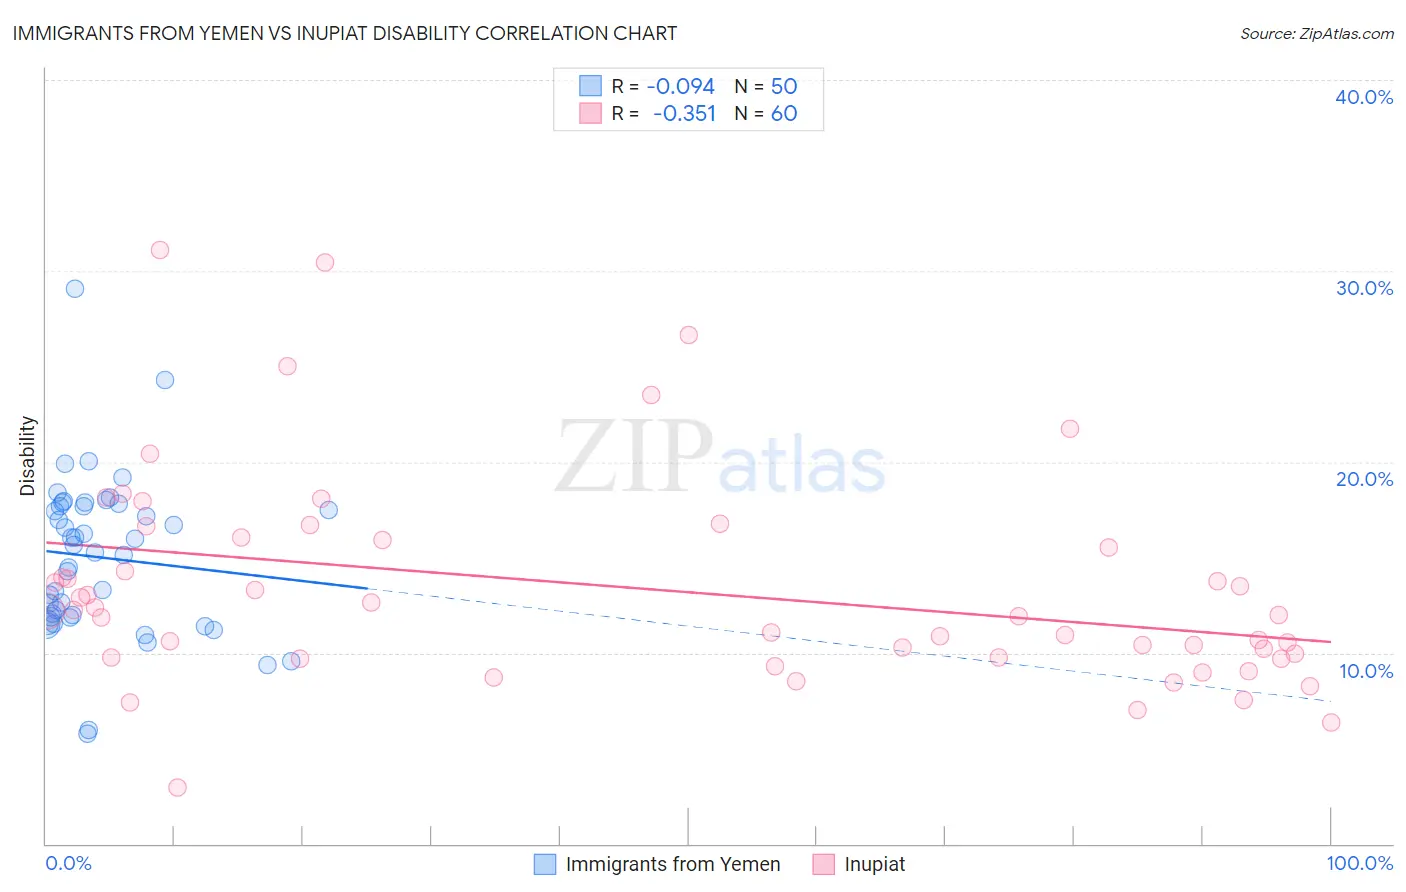
Immigrants from Yemen vs Inupiat Disability Correlation Chart
The statistical analysis conducted on geographies consisting of 82,432,981 people shows a slight negative correlation between the proportion of Immigrants from Yemen and percentage of population with a disability in the United States with a correlation coefficient (R) of -0.094 and weighted average of 12.6%. Similarly, the statistical analysis conducted on geographies consisting of 96,338,624 people shows a mild negative correlation between the proportion of Inupiat and percentage of population with a disability in the United States with a correlation coefficient (R) of -0.351 and weighted average of 12.2%, a difference of 3.9%.
Disability Correlation Summary
| Measurement | Immigrants from Yemen | Inupiat |
| Minimum | 5.8% | 2.9% |
| Maximum | 29.1% | 31.1% |
| Range | 23.3% | 28.2% |
| Mean | 15.0% | 13.4% |
| Median | 15.5% | 12.1% |
| Interquartile 25% (IQ1) | 11.9% | 9.8% |
| Interquartile 75% (IQ3) | 17.7% | 16.0% |
| Interquartile Range (IQR) | 5.8% | 6.2% |
| Standard Deviation (Sample) | 4.2% | 5.6% |
| Standard Deviation (Population) | 4.1% | 5.6% |
Similar Demographics by Disability
Demographics Similar to Immigrants from Yemen by Disability
In terms of disability, the demographic groups most similar to Immigrants from Yemen are Portuguese (12.6%, a difference of 0.050%), Immigrants from Dominican Republic (12.6%, a difference of 0.44%), Dominican (12.7%, a difference of 0.49%), Bangladeshi (12.6%, a difference of 0.53%), and Finnish (12.7%, a difference of 0.66%).
| Demographics | Rating | Rank | Disability |
| Immigrants | Germany | 0.2 /100 | #264 | Tragic 12.5% |
| U.S. Virgin Islanders | 0.2 /100 | #265 | Tragic 12.5% |
| Czechoslovakians | 0.2 /100 | #266 | Tragic 12.5% |
| Spaniards | 0.2 /100 | #267 | Tragic 12.5% |
| Bangladeshis | 0.1 /100 | #268 | Tragic 12.6% |
| Immigrants | Dominican Republic | 0.1 /100 | #269 | Tragic 12.6% |
| Portuguese | 0.1 /100 | #270 | Tragic 12.6% |
| Immigrants | Yemen | 0.1 /100 | #271 | Tragic 12.6% |
| Dominicans | 0.0 /100 | #272 | Tragic 12.7% |
| Finns | 0.0 /100 | #273 | Tragic 12.7% |
| Nepalese | 0.0 /100 | #274 | Tragic 12.8% |
| Sioux | 0.0 /100 | #275 | Tragic 12.8% |
| Hmong | 0.0 /100 | #276 | Tragic 12.8% |
| Dutch | 0.0 /100 | #277 | Tragic 12.8% |
| Germans | 0.0 /100 | #278 | Tragic 12.8% |
Demographics Similar to Inupiat by Disability
In terms of disability, the demographic groups most similar to Inupiat are West Indian (12.2%, a difference of 0.020%), Samoan (12.2%, a difference of 0.080%), Malaysian (12.2%, a difference of 0.11%), Italian (12.2%, a difference of 0.12%), and Alsatian (12.1%, a difference of 0.16%).
| Demographics | Rating | Rank | Disability |
| Spanish American Indians | 4.1 /100 | #222 | Tragic 12.1% |
| Hispanics or Latinos | 3.9 /100 | #223 | Tragic 12.1% |
| Mexicans | 3.7 /100 | #224 | Tragic 12.1% |
| Senegalese | 3.5 /100 | #225 | Tragic 12.1% |
| Jamaicans | 3.3 /100 | #226 | Tragic 12.1% |
| Alsatians | 3.3 /100 | #227 | Tragic 12.1% |
| West Indians | 2.9 /100 | #228 | Tragic 12.2% |
| Inupiat | 2.8 /100 | #229 | Tragic 12.2% |
| Samoans | 2.6 /100 | #230 | Tragic 12.2% |
| Malaysians | 2.5 /100 | #231 | Tragic 12.2% |
| Italians | 2.5 /100 | #232 | Tragic 12.2% |
| Bahamians | 2.3 /100 | #233 | Tragic 12.2% |
| Japanese | 2.3 /100 | #234 | Tragic 12.2% |
| Yup'ik | 2.2 /100 | #235 | Tragic 12.2% |
| Chinese | 2.0 /100 | #236 | Tragic 12.2% |