Immigrants from Korea vs Inupiat Disability
COMPARE
Immigrants from Korea
Inupiat
Disability
Disability Comparison
Immigrants from Korea
Inupiat
10.2%
DISABILITY
100.0/ 100
METRIC RATING
14th/ 347
METRIC RANK
12.2%
DISABILITY
2.8/ 100
METRIC RATING
229th/ 347
METRIC RANK
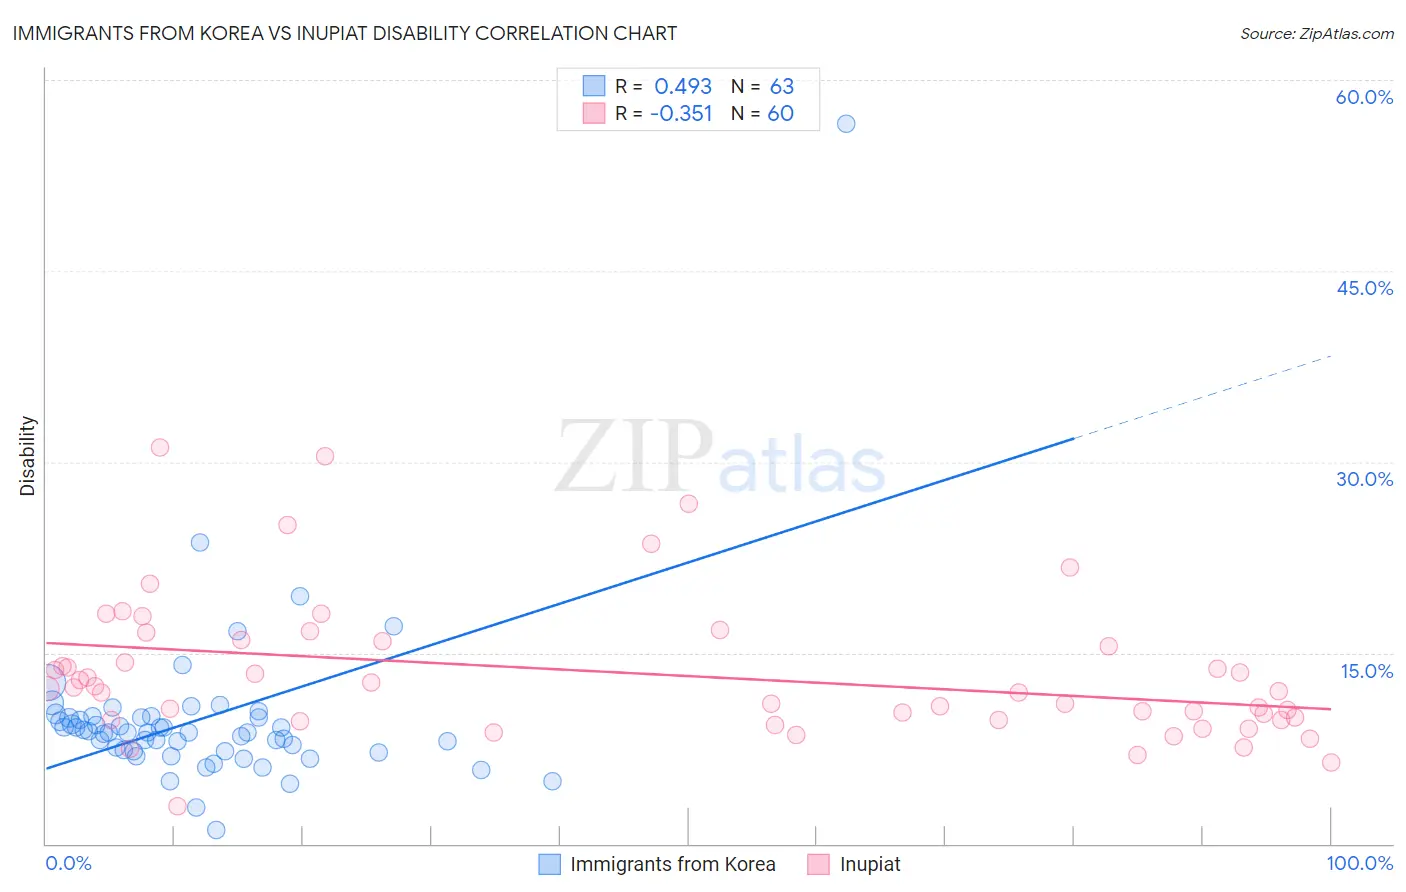
Immigrants from Korea vs Inupiat Disability Correlation Chart
The statistical analysis conducted on geographies consisting of 416,299,820 people shows a moderate positive correlation between the proportion of Immigrants from Korea and percentage of population with a disability in the United States with a correlation coefficient (R) of 0.493 and weighted average of 10.2%. Similarly, the statistical analysis conducted on geographies consisting of 96,338,624 people shows a mild negative correlation between the proportion of Inupiat and percentage of population with a disability in the United States with a correlation coefficient (R) of -0.351 and weighted average of 12.2%, a difference of 18.9%.
Disability Correlation Summary
| Measurement | Immigrants from Korea | Inupiat |
| Minimum | 1.1% | 2.9% |
| Maximum | 56.6% | 31.1% |
| Range | 55.5% | 28.2% |
| Mean | 9.8% | 13.4% |
| Median | 8.8% | 12.1% |
| Interquartile 25% (IQ1) | 7.3% | 9.8% |
| Interquartile 75% (IQ3) | 9.9% | 16.0% |
| Interquartile Range (IQR) | 2.6% | 6.2% |
| Standard Deviation (Sample) | 6.9% | 5.6% |
| Standard Deviation (Population) | 6.9% | 5.6% |
Similar Demographics by Disability
Demographics Similar to Immigrants from Korea by Disability
In terms of disability, the demographic groups most similar to Immigrants from Korea are Okinawan (10.3%, a difference of 0.31%), Indian (Asian) (10.3%, a difference of 0.37%), Immigrants from Iran (10.3%, a difference of 0.44%), Immigrants from Eastern Asia (10.2%, a difference of 0.60%), and Immigrants from Israel (10.1%, a difference of 0.81%).
| Demographics | Rating | Rank | Disability |
| Immigrants | Singapore | 100.0 /100 | #7 | Exceptional 10.0% |
| Bolivians | 100.0 /100 | #8 | Exceptional 10.0% |
| Immigrants | Hong Kong | 100.0 /100 | #9 | Exceptional 10.0% |
| Immigrants | China | 100.0 /100 | #10 | Exceptional 10.1% |
| Iranians | 100.0 /100 | #11 | Exceptional 10.1% |
| Immigrants | Israel | 100.0 /100 | #12 | Exceptional 10.1% |
| Immigrants | Eastern Asia | 100.0 /100 | #13 | Exceptional 10.2% |
| Immigrants | Korea | 100.0 /100 | #14 | Exceptional 10.2% |
| Okinawans | 100.0 /100 | #15 | Exceptional 10.3% |
| Indians (Asian) | 100.0 /100 | #16 | Exceptional 10.3% |
| Immigrants | Iran | 100.0 /100 | #17 | Exceptional 10.3% |
| Burmese | 100.0 /100 | #18 | Exceptional 10.4% |
| Immigrants | Pakistan | 100.0 /100 | #19 | Exceptional 10.4% |
| Immigrants | Venezuela | 100.0 /100 | #20 | Exceptional 10.4% |
| Asians | 100.0 /100 | #21 | Exceptional 10.4% |
Demographics Similar to Inupiat by Disability
In terms of disability, the demographic groups most similar to Inupiat are West Indian (12.2%, a difference of 0.020%), Samoan (12.2%, a difference of 0.080%), Malaysian (12.2%, a difference of 0.11%), Italian (12.2%, a difference of 0.12%), and Alsatian (12.1%, a difference of 0.16%).
| Demographics | Rating | Rank | Disability |
| Spanish American Indians | 4.1 /100 | #222 | Tragic 12.1% |
| Hispanics or Latinos | 3.9 /100 | #223 | Tragic 12.1% |
| Mexicans | 3.7 /100 | #224 | Tragic 12.1% |
| Senegalese | 3.5 /100 | #225 | Tragic 12.1% |
| Jamaicans | 3.3 /100 | #226 | Tragic 12.1% |
| Alsatians | 3.3 /100 | #227 | Tragic 12.1% |
| West Indians | 2.9 /100 | #228 | Tragic 12.2% |
| Inupiat | 2.8 /100 | #229 | Tragic 12.2% |
| Samoans | 2.6 /100 | #230 | Tragic 12.2% |
| Malaysians | 2.5 /100 | #231 | Tragic 12.2% |
| Italians | 2.5 /100 | #232 | Tragic 12.2% |
| Bahamians | 2.3 /100 | #233 | Tragic 12.2% |
| Japanese | 2.3 /100 | #234 | Tragic 12.2% |
| Yup'ik | 2.2 /100 | #235 | Tragic 12.2% |
| Chinese | 2.0 /100 | #236 | Tragic 12.2% |