Potawatomi vs Ethiopian Disability
COMPARE
Potawatomi
Ethiopian
Disability
Disability Comparison
Potawatomi
Ethiopians
14.2%
DISABILITY
0.0/ 100
METRIC RATING
329th/ 347
METRIC RANK
10.7%
DISABILITY
100.0/ 100
METRIC RATING
36th/ 347
METRIC RANK
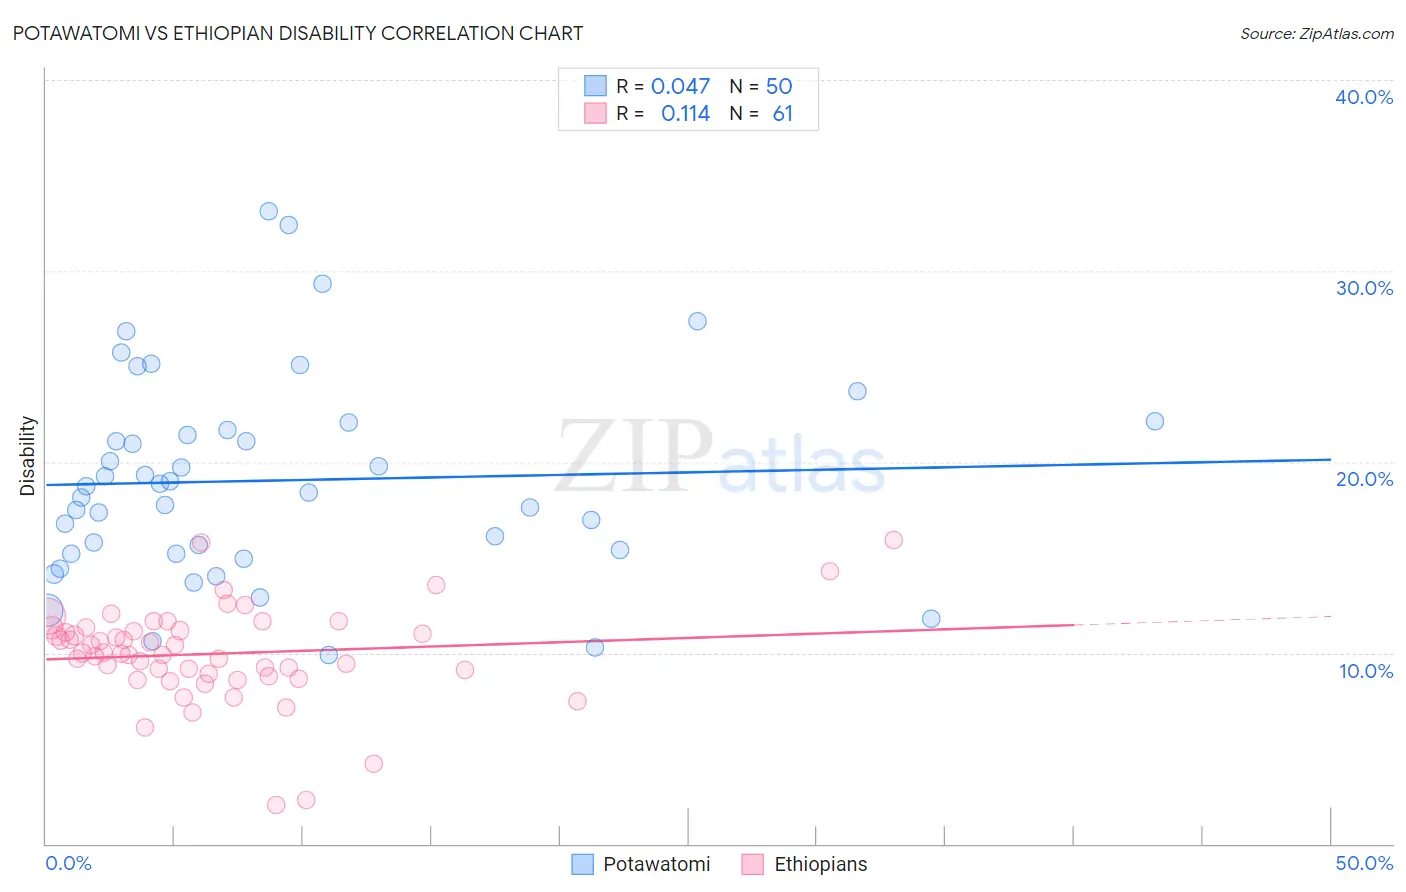
Potawatomi vs Ethiopian Disability Correlation Chart
The statistical analysis conducted on geographies consisting of 117,767,457 people shows no correlation between the proportion of Potawatomi and percentage of population with a disability in the United States with a correlation coefficient (R) of 0.047 and weighted average of 14.2%. Similarly, the statistical analysis conducted on geographies consisting of 223,240,308 people shows a poor positive correlation between the proportion of Ethiopians and percentage of population with a disability in the United States with a correlation coefficient (R) of 0.114 and weighted average of 10.7%, a difference of 32.4%.
Disability Correlation Summary
| Measurement | Potawatomi | Ethiopian |
| Minimum | 9.9% | 2.1% |
| Maximum | 33.1% | 15.9% |
| Range | 23.2% | 13.9% |
| Mean | 19.0% | 10.0% |
| Median | 18.5% | 10.0% |
| Interquartile 25% (IQ1) | 15.2% | 8.8% |
| Interquartile 75% (IQ3) | 21.7% | 11.2% |
| Interquartile Range (IQR) | 6.5% | 2.4% |
| Standard Deviation (Sample) | 5.4% | 2.5% |
| Standard Deviation (Population) | 5.3% | 2.5% |
Similar Demographics by Disability
Demographics Similar to Potawatomi by Disability
In terms of disability, the demographic groups most similar to Potawatomi are Ottawa (14.2%, a difference of 0.12%), Immigrants from the Azores (14.2%, a difference of 0.12%), Osage (14.2%, a difference of 0.14%), Native/Alaskan (14.2%, a difference of 0.17%), and Chippewa (14.1%, a difference of 0.22%).
| Demographics | Rating | Rank | Disability |
| Americans | 0.0 /100 | #322 | Tragic 13.9% |
| Comanche | 0.0 /100 | #323 | Tragic 14.1% |
| Chippewa | 0.0 /100 | #324 | Tragic 14.1% |
| Natives/Alaskans | 0.0 /100 | #325 | Tragic 14.2% |
| Osage | 0.0 /100 | #326 | Tragic 14.2% |
| Ottawa | 0.0 /100 | #327 | Tragic 14.2% |
| Immigrants | Azores | 0.0 /100 | #328 | Tragic 14.2% |
| Potawatomi | 0.0 /100 | #329 | Tragic 14.2% |
| Navajo | 0.0 /100 | #330 | Tragic 14.3% |
| Alaskan Athabascans | 0.0 /100 | #331 | Tragic 14.4% |
| Pueblo | 0.0 /100 | #332 | Tragic 14.4% |
| Cajuns | 0.0 /100 | #333 | Tragic 14.6% |
| Yuman | 0.0 /100 | #334 | Tragic 14.6% |
| Tohono O'odham | 0.0 /100 | #335 | Tragic 14.8% |
| Cherokee | 0.0 /100 | #336 | Tragic 14.8% |
Demographics Similar to Ethiopians by Disability
In terms of disability, the demographic groups most similar to Ethiopians are Turkish (10.7%, a difference of 0.010%), Immigrants from Indonesia (10.7%, a difference of 0.060%), Immigrants from Ethiopia (10.7%, a difference of 0.070%), Immigrants from Kuwait (10.7%, a difference of 0.29%), and Afghan (10.8%, a difference of 0.45%).
| Demographics | Rating | Rank | Disability |
| Immigrants | Argentina | 100.0 /100 | #29 | Exceptional 10.6% |
| Immigrants | Turkey | 100.0 /100 | #30 | Exceptional 10.6% |
| Immigrants | Egypt | 100.0 /100 | #31 | Exceptional 10.6% |
| Paraguayans | 100.0 /100 | #32 | Exceptional 10.6% |
| Immigrants | Kuwait | 100.0 /100 | #33 | Exceptional 10.7% |
| Immigrants | Ethiopia | 100.0 /100 | #34 | Exceptional 10.7% |
| Immigrants | Indonesia | 100.0 /100 | #35 | Exceptional 10.7% |
| Ethiopians | 100.0 /100 | #36 | Exceptional 10.7% |
| Turks | 100.0 /100 | #37 | Exceptional 10.7% |
| Afghans | 99.9 /100 | #38 | Exceptional 10.8% |
| Cambodians | 99.9 /100 | #39 | Exceptional 10.8% |
| Mongolians | 99.9 /100 | #40 | Exceptional 10.8% |
| Immigrants | Australia | 99.9 /100 | #41 | Exceptional 10.8% |
| Immigrants | Nepal | 99.9 /100 | #42 | Exceptional 10.8% |
| Israelis | 99.9 /100 | #43 | Exceptional 10.8% |