Spanish American vs Inupiat Disability
COMPARE
Spanish American
Inupiat
Disability
Disability Comparison
Spanish Americans
Inupiat
13.6%
DISABILITY
0.0/ 100
METRIC RATING
312th/ 347
METRIC RANK
12.2%
DISABILITY
2.8/ 100
METRIC RATING
229th/ 347
METRIC RANK
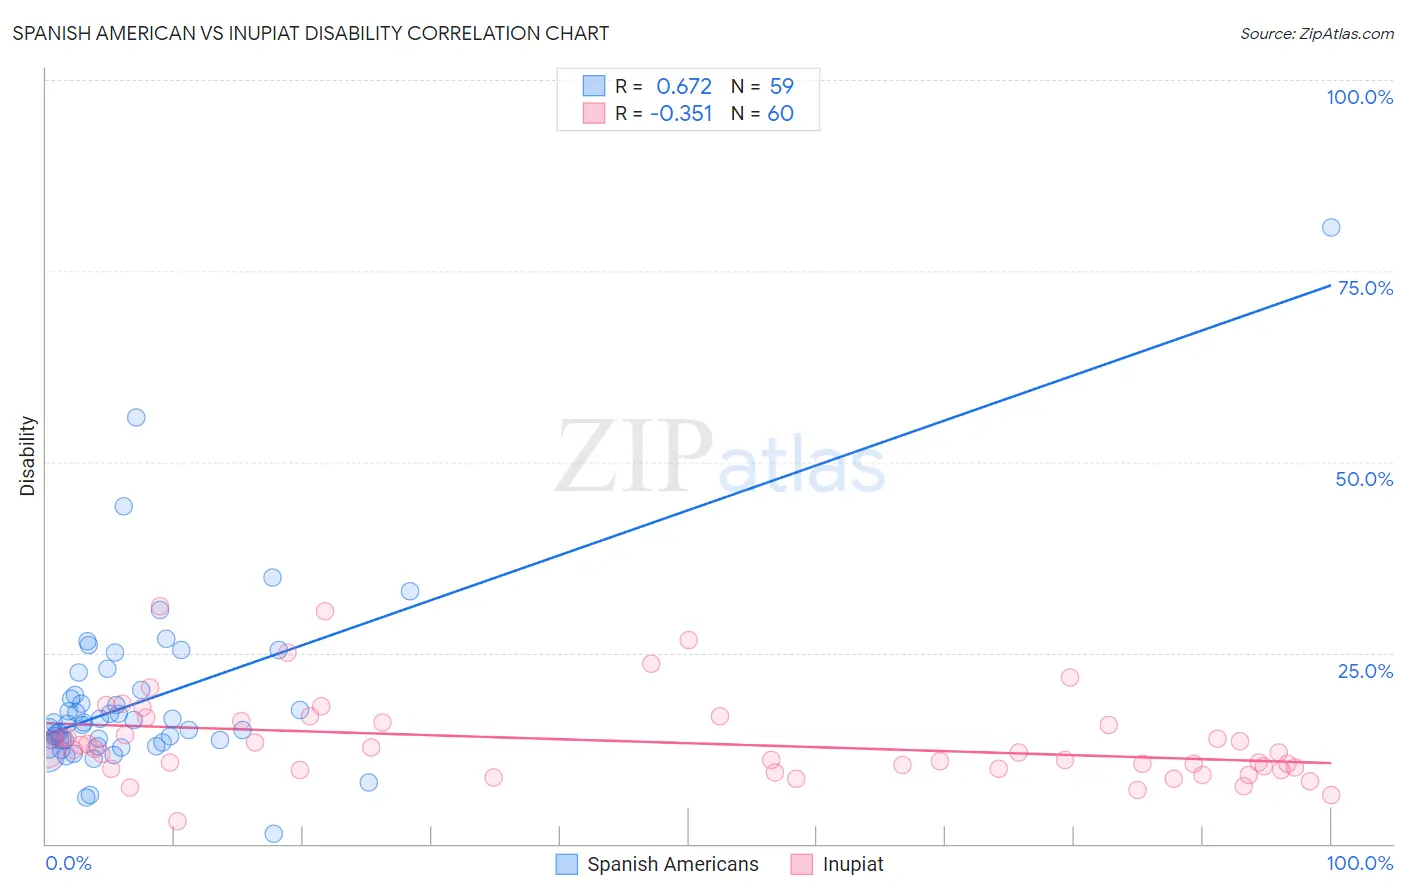
Spanish American vs Inupiat Disability Correlation Chart
The statistical analysis conducted on geographies consisting of 103,168,597 people shows a significant positive correlation between the proportion of Spanish Americans and percentage of population with a disability in the United States with a correlation coefficient (R) of 0.672 and weighted average of 13.6%. Similarly, the statistical analysis conducted on geographies consisting of 96,338,624 people shows a mild negative correlation between the proportion of Inupiat and percentage of population with a disability in the United States with a correlation coefficient (R) of -0.351 and weighted average of 12.2%, a difference of 12.2%.
Disability Correlation Summary
| Measurement | Spanish American | Inupiat |
| Minimum | 1.3% | 2.9% |
| Maximum | 80.7% | 31.1% |
| Range | 79.5% | 28.2% |
| Mean | 18.8% | 13.4% |
| Median | 15.7% | 12.1% |
| Interquartile 25% (IQ1) | 13.3% | 9.8% |
| Interquartile 75% (IQ3) | 20.1% | 16.0% |
| Interquartile Range (IQR) | 6.8% | 6.2% |
| Standard Deviation (Sample) | 12.0% | 5.6% |
| Standard Deviation (Population) | 11.9% | 5.6% |
Similar Demographics by Disability
Demographics Similar to Spanish Americans by Disability
In terms of disability, the demographic groups most similar to Spanish Americans are Delaware (13.6%, a difference of 0.24%), Blackfeet (13.6%, a difference of 0.28%), Cree (13.7%, a difference of 0.35%), Black/African American (13.7%, a difference of 0.39%), and Puget Sound Salish (13.7%, a difference of 0.39%).
| Demographics | Rating | Rank | Disability |
| French Canadians | 0.0 /100 | #305 | Tragic 13.4% |
| Cape Verdeans | 0.0 /100 | #306 | Tragic 13.5% |
| Shoshone | 0.0 /100 | #307 | Tragic 13.5% |
| French American Indians | 0.0 /100 | #308 | Tragic 13.5% |
| Tlingit-Haida | 0.0 /100 | #309 | Tragic 13.5% |
| Blackfeet | 0.0 /100 | #310 | Tragic 13.6% |
| Delaware | 0.0 /100 | #311 | Tragic 13.6% |
| Spanish Americans | 0.0 /100 | #312 | Tragic 13.6% |
| Cree | 0.0 /100 | #313 | Tragic 13.7% |
| Blacks/African Americans | 0.0 /100 | #314 | Tragic 13.7% |
| Puget Sound Salish | 0.0 /100 | #315 | Tragic 13.7% |
| Pima | 0.0 /100 | #316 | Tragic 13.7% |
| Immigrants | Cabo Verde | 0.0 /100 | #317 | Tragic 13.7% |
| Menominee | 0.0 /100 | #318 | Tragic 13.8% |
| Iroquois | 0.0 /100 | #319 | Tragic 13.8% |
Demographics Similar to Inupiat by Disability
In terms of disability, the demographic groups most similar to Inupiat are West Indian (12.2%, a difference of 0.020%), Samoan (12.2%, a difference of 0.080%), Malaysian (12.2%, a difference of 0.11%), Italian (12.2%, a difference of 0.12%), and Alsatian (12.1%, a difference of 0.16%).
| Demographics | Rating | Rank | Disability |
| Spanish American Indians | 4.1 /100 | #222 | Tragic 12.1% |
| Hispanics or Latinos | 3.9 /100 | #223 | Tragic 12.1% |
| Mexicans | 3.7 /100 | #224 | Tragic 12.1% |
| Senegalese | 3.5 /100 | #225 | Tragic 12.1% |
| Jamaicans | 3.3 /100 | #226 | Tragic 12.1% |
| Alsatians | 3.3 /100 | #227 | Tragic 12.1% |
| West Indians | 2.9 /100 | #228 | Tragic 12.2% |
| Inupiat | 2.8 /100 | #229 | Tragic 12.2% |
| Samoans | 2.6 /100 | #230 | Tragic 12.2% |
| Malaysians | 2.5 /100 | #231 | Tragic 12.2% |
| Italians | 2.5 /100 | #232 | Tragic 12.2% |
| Bahamians | 2.3 /100 | #233 | Tragic 12.2% |
| Japanese | 2.3 /100 | #234 | Tragic 12.2% |
| Yup'ik | 2.2 /100 | #235 | Tragic 12.2% |
| Chinese | 2.0 /100 | #236 | Tragic 12.2% |