Potawatomi vs Immigrants from Australia Disability
COMPARE
Potawatomi
Immigrants from Australia
Disability
Disability Comparison
Potawatomi
Immigrants from Australia
14.2%
DISABILITY
0.0/ 100
METRIC RATING
329th/ 347
METRIC RANK
10.8%
DISABILITY
99.9/ 100
METRIC RATING
41st/ 347
METRIC RANK
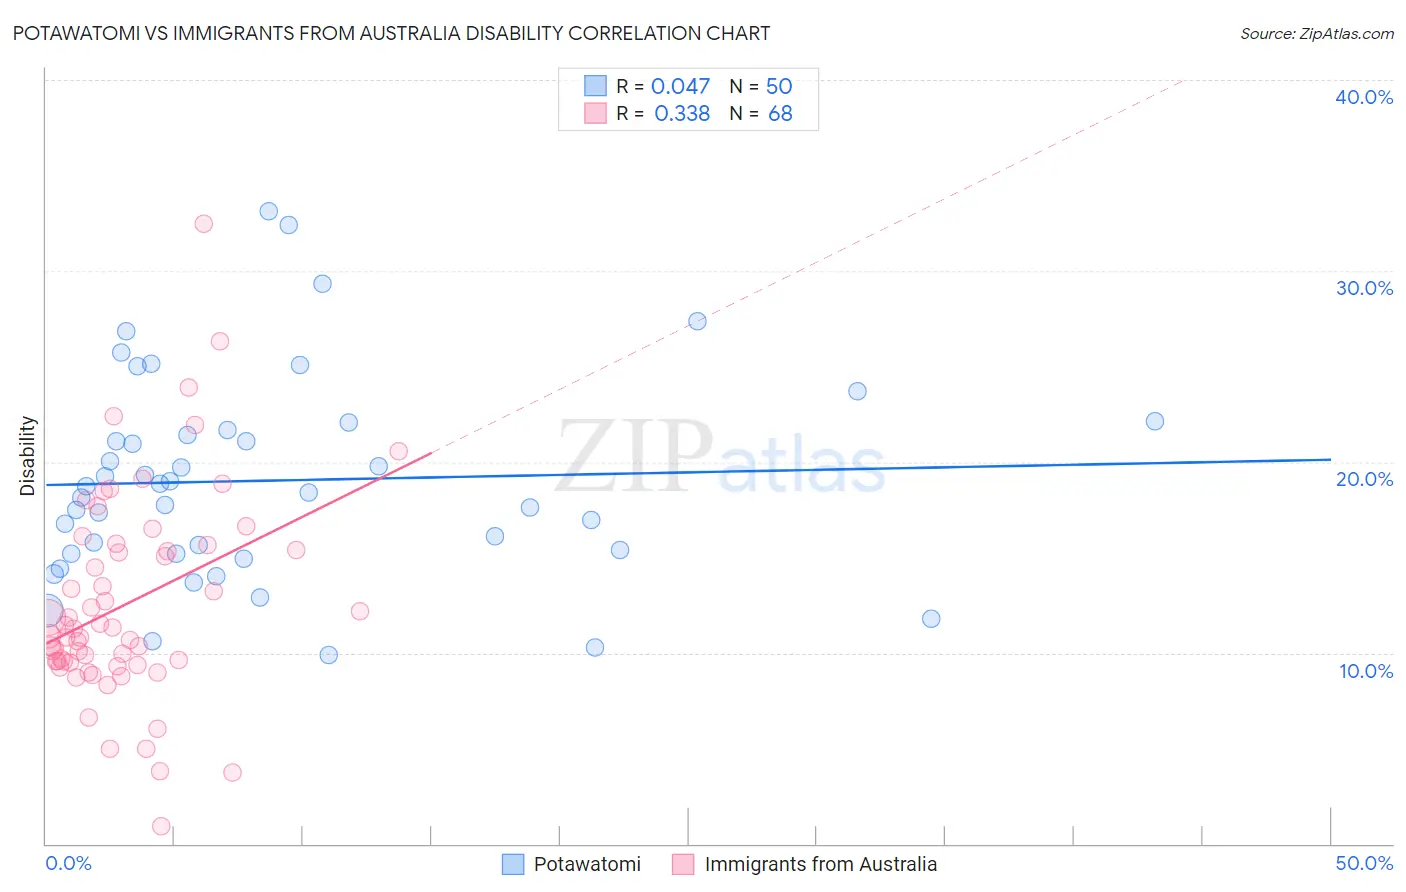
Potawatomi vs Immigrants from Australia Disability Correlation Chart
The statistical analysis conducted on geographies consisting of 117,767,457 people shows no correlation between the proportion of Potawatomi and percentage of population with a disability in the United States with a correlation coefficient (R) of 0.047 and weighted average of 14.2%. Similarly, the statistical analysis conducted on geographies consisting of 227,205,493 people shows a mild positive correlation between the proportion of Immigrants from Australia and percentage of population with a disability in the United States with a correlation coefficient (R) of 0.338 and weighted average of 10.8%, a difference of 31.6%.
Disability Correlation Summary
| Measurement | Potawatomi | Immigrants from Australia |
| Minimum | 9.9% | 0.92% |
| Maximum | 33.1% | 32.5% |
| Range | 23.2% | 31.6% |
| Mean | 19.0% | 12.6% |
| Median | 18.5% | 11.1% |
| Interquartile 25% (IQ1) | 15.2% | 9.5% |
| Interquartile 75% (IQ3) | 21.7% | 15.5% |
| Interquartile Range (IQR) | 6.5% | 6.0% |
| Standard Deviation (Sample) | 5.4% | 5.5% |
| Standard Deviation (Population) | 5.3% | 5.4% |
Similar Demographics by Disability
Demographics Similar to Potawatomi by Disability
In terms of disability, the demographic groups most similar to Potawatomi are Ottawa (14.2%, a difference of 0.12%), Immigrants from the Azores (14.2%, a difference of 0.12%), Osage (14.2%, a difference of 0.14%), Native/Alaskan (14.2%, a difference of 0.17%), and Chippewa (14.1%, a difference of 0.22%).
| Demographics | Rating | Rank | Disability |
| Americans | 0.0 /100 | #322 | Tragic 13.9% |
| Comanche | 0.0 /100 | #323 | Tragic 14.1% |
| Chippewa | 0.0 /100 | #324 | Tragic 14.1% |
| Natives/Alaskans | 0.0 /100 | #325 | Tragic 14.2% |
| Osage | 0.0 /100 | #326 | Tragic 14.2% |
| Ottawa | 0.0 /100 | #327 | Tragic 14.2% |
| Immigrants | Azores | 0.0 /100 | #328 | Tragic 14.2% |
| Potawatomi | 0.0 /100 | #329 | Tragic 14.2% |
| Navajo | 0.0 /100 | #330 | Tragic 14.3% |
| Alaskan Athabascans | 0.0 /100 | #331 | Tragic 14.4% |
| Pueblo | 0.0 /100 | #332 | Tragic 14.4% |
| Cajuns | 0.0 /100 | #333 | Tragic 14.6% |
| Yuman | 0.0 /100 | #334 | Tragic 14.6% |
| Tohono O'odham | 0.0 /100 | #335 | Tragic 14.8% |
| Cherokee | 0.0 /100 | #336 | Tragic 14.8% |
Demographics Similar to Immigrants from Australia by Disability
In terms of disability, the demographic groups most similar to Immigrants from Australia are Cambodian (10.8%, a difference of 0.040%), Mongolian (10.8%, a difference of 0.040%), Immigrants from Nepal (10.8%, a difference of 0.10%), Afghan (10.8%, a difference of 0.15%), and Israeli (10.8%, a difference of 0.15%).
| Demographics | Rating | Rank | Disability |
| Immigrants | Ethiopia | 100.0 /100 | #34 | Exceptional 10.7% |
| Immigrants | Indonesia | 100.0 /100 | #35 | Exceptional 10.7% |
| Ethiopians | 100.0 /100 | #36 | Exceptional 10.7% |
| Turks | 100.0 /100 | #37 | Exceptional 10.7% |
| Afghans | 99.9 /100 | #38 | Exceptional 10.8% |
| Cambodians | 99.9 /100 | #39 | Exceptional 10.8% |
| Mongolians | 99.9 /100 | #40 | Exceptional 10.8% |
| Immigrants | Australia | 99.9 /100 | #41 | Exceptional 10.8% |
| Immigrants | Nepal | 99.9 /100 | #42 | Exceptional 10.8% |
| Israelis | 99.9 /100 | #43 | Exceptional 10.8% |
| Immigrants | Japan | 99.9 /100 | #44 | Exceptional 10.8% |
| Immigrants | Peru | 99.9 /100 | #45 | Exceptional 10.8% |
| Tongans | 99.9 /100 | #46 | Exceptional 10.8% |
| Taiwanese | 99.9 /100 | #47 | Exceptional 10.8% |
| Soviet Union | 99.9 /100 | #48 | Exceptional 10.9% |