Potawatomi vs Inupiat Average Family Size
COMPARE
Potawatomi
Inupiat
Average Family Size
Average Family Size Comparison
Potawatomi
Inupiat
3.16
AVERAGE FAMILY SIZE
1.3/ 100
METRIC RATING
259th/ 347
METRIC RANK
3.63
AVERAGE FAMILY SIZE
100.0/ 100
METRIC RATING
7th/ 347
METRIC RANK
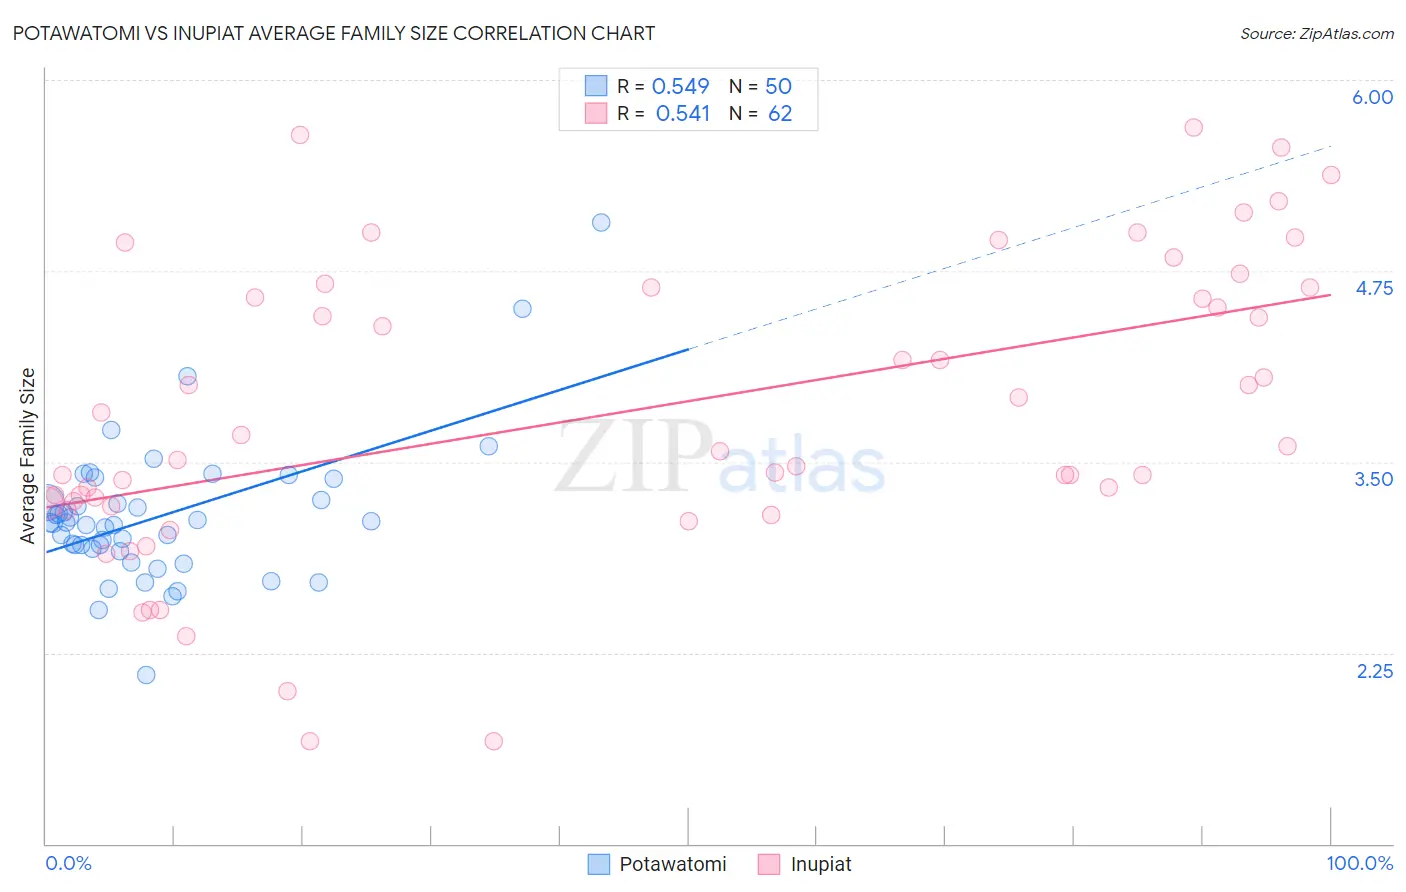
Potawatomi vs Inupiat Average Family Size Correlation Chart
The statistical analysis conducted on geographies consisting of 117,759,864 people shows a substantial positive correlation between the proportion of Potawatomi and average family size in the United States with a correlation coefficient (R) of 0.549 and weighted average of 3.16. Similarly, the statistical analysis conducted on geographies consisting of 96,321,783 people shows a substantial positive correlation between the proportion of Inupiat and average family size in the United States with a correlation coefficient (R) of 0.541 and weighted average of 3.63, a difference of 14.6%.
Average Family Size Correlation Summary
| Measurement | Potawatomi | Inupiat |
| Minimum | 2.10 | 1.67 |
| Maximum | 5.07 | 5.69 |
| Range | 2.97 | 4.02 |
| Mean | 3.15 | 3.82 |
| Median | 3.10 | 3.58 |
| Interquartile 25% (IQ1) | 2.93 | 3.23 |
| Interquartile 75% (IQ3) | 3.25 | 4.64 |
| Interquartile Range (IQR) | 0.32 | 1.41 |
| Standard Deviation (Sample) | 0.47 | 0.97 |
| Standard Deviation (Population) | 0.47 | 0.96 |
Similar Demographics by Average Family Size
Demographics Similar to Potawatomi by Average Family Size
In terms of average family size, the demographic groups most similar to Potawatomi are Turkish (3.16, a difference of 0.0%), Immigrants from Albania (3.16, a difference of 0.0%), Immigrants from North Macedonia (3.16, a difference of 0.010%), Immigrants from Russia (3.16, a difference of 0.020%), and Albanian (3.17, a difference of 0.050%).
| Demographics | Rating | Rank | Average Family Size |
| Immigrants | Saudi Arabia | 1.7 /100 | #252 | Tragic 3.17 |
| South Africans | 1.7 /100 | #253 | Tragic 3.17 |
| Immigrants | Hungary | 1.7 /100 | #254 | Tragic 3.17 |
| Cape Verdeans | 1.6 /100 | #255 | Tragic 3.17 |
| Immigrants | Kazakhstan | 1.5 /100 | #256 | Tragic 3.17 |
| Albanians | 1.5 /100 | #257 | Tragic 3.17 |
| Turks | 1.3 /100 | #258 | Tragic 3.16 |
| Potawatomi | 1.3 /100 | #259 | Tragic 3.16 |
| Immigrants | Albania | 1.3 /100 | #260 | Tragic 3.16 |
| Immigrants | North Macedonia | 1.3 /100 | #261 | Tragic 3.16 |
| Immigrants | Russia | 1.3 /100 | #262 | Tragic 3.16 |
| Immigrants | Bulgaria | 1.0 /100 | #263 | Tragic 3.16 |
| Americans | 1.0 /100 | #264 | Tragic 3.16 |
| Immigrants | South Africa | 0.9 /100 | #265 | Tragic 3.16 |
| Immigrants | Greece | 0.9 /100 | #266 | Tragic 3.16 |
Demographics Similar to Inupiat by Average Family Size
In terms of average family size, the demographic groups most similar to Inupiat are Arapaho (3.64, a difference of 0.22%), Navajo (3.65, a difference of 0.48%), Immigrants from Yemen (3.60, a difference of 0.87%), Hopi (3.60, a difference of 0.87%), and Spanish American Indian (3.58, a difference of 1.2%).
| Demographics | Rating | Rank | Average Family Size |
| Yup'ik | 100 /100 | #1 | Exceptional 4.00 |
| Crow | 100 /100 | #2 | Exceptional 3.82 |
| Pueblo | 100 /100 | #3 | Exceptional 3.79 |
| Pima | 100 /100 | #4 | Exceptional 3.75 |
| Navajo | 100.0 /100 | #5 | Exceptional 3.65 |
| Arapaho | 100.0 /100 | #6 | Exceptional 3.64 |
| Inupiat | 100.0 /100 | #7 | Exceptional 3.63 |
| Immigrants | Yemen | 100.0 /100 | #8 | Exceptional 3.60 |
| Hopi | 100.0 /100 | #9 | Exceptional 3.60 |
| Spanish American Indians | 100.0 /100 | #10 | Exceptional 3.58 |
| Tohono O'odham | 100.0 /100 | #11 | Exceptional 3.53 |
| Immigrants | Mexico | 100.0 /100 | #12 | Exceptional 3.52 |
| Sioux | 100.0 /100 | #13 | Exceptional 3.52 |
| Immigrants | Central America | 100.0 /100 | #14 | Exceptional 3.49 |
| Tongans | 100.0 /100 | #15 | Exceptional 3.49 |