Cypriot vs Inupiat Disability
COMPARE
Cypriot
Inupiat
Disability
Disability Comparison
Cypriots
Inupiat
10.6%
DISABILITY
100.0/ 100
METRIC RATING
27th/ 347
METRIC RANK
12.2%
DISABILITY
2.8/ 100
METRIC RATING
229th/ 347
METRIC RANK
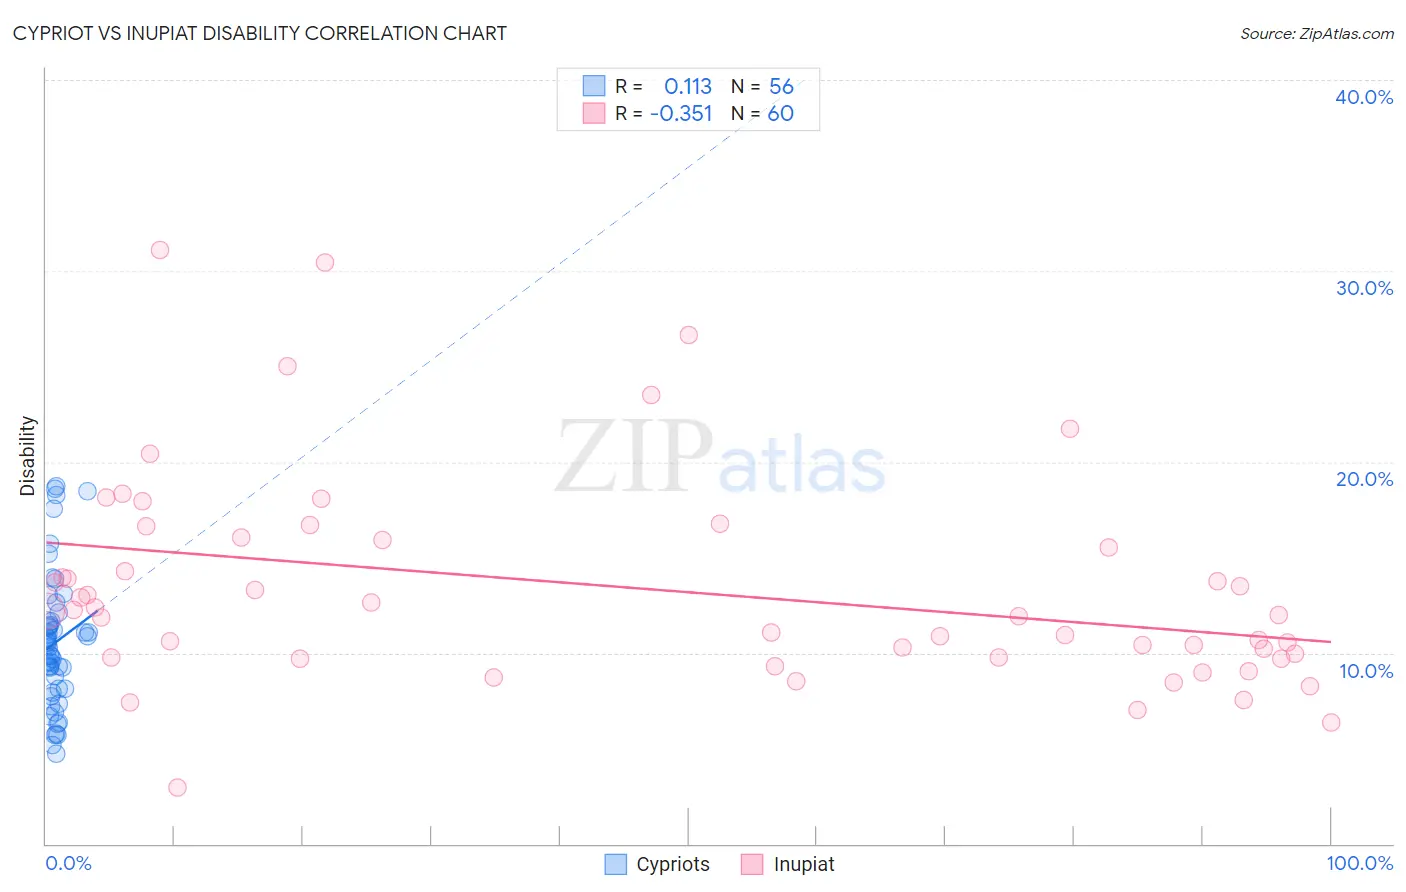
Cypriot vs Inupiat Disability Correlation Chart
The statistical analysis conducted on geographies consisting of 61,867,698 people shows a poor positive correlation between the proportion of Cypriots and percentage of population with a disability in the United States with a correlation coefficient (R) of 0.113 and weighted average of 10.6%. Similarly, the statistical analysis conducted on geographies consisting of 96,338,624 people shows a mild negative correlation between the proportion of Inupiat and percentage of population with a disability in the United States with a correlation coefficient (R) of -0.351 and weighted average of 12.2%, a difference of 14.8%.
Disability Correlation Summary
| Measurement | Cypriot | Inupiat |
| Minimum | 4.7% | 2.9% |
| Maximum | 18.7% | 31.1% |
| Range | 14.0% | 28.2% |
| Mean | 10.5% | 13.4% |
| Median | 10.3% | 12.1% |
| Interquartile 25% (IQ1) | 8.1% | 9.8% |
| Interquartile 75% (IQ3) | 11.6% | 16.0% |
| Interquartile Range (IQR) | 3.5% | 6.2% |
| Standard Deviation (Sample) | 3.5% | 5.6% |
| Standard Deviation (Population) | 3.4% | 5.6% |
Similar Demographics by Disability
Demographics Similar to Cypriots by Disability
In terms of disability, the demographic groups most similar to Cypriots are Argentinean (10.6%, a difference of 0.010%), Immigrants from Malaysia (10.6%, a difference of 0.060%), Egyptian (10.6%, a difference of 0.13%), Immigrants from Argentina (10.6%, a difference of 0.26%), and Immigrants from Turkey (10.6%, a difference of 0.41%).
| Demographics | Rating | Rank | Disability |
| Immigrants | Venezuela | 100.0 /100 | #20 | Exceptional 10.4% |
| Asians | 100.0 /100 | #21 | Exceptional 10.4% |
| Immigrants | Sri Lanka | 100.0 /100 | #22 | Exceptional 10.5% |
| Immigrants | Asia | 100.0 /100 | #23 | Exceptional 10.5% |
| Venezuelans | 100.0 /100 | #24 | Exceptional 10.5% |
| Immigrants | Malaysia | 100.0 /100 | #25 | Exceptional 10.6% |
| Argentineans | 100.0 /100 | #26 | Exceptional 10.6% |
| Cypriots | 100.0 /100 | #27 | Exceptional 10.6% |
| Egyptians | 100.0 /100 | #28 | Exceptional 10.6% |
| Immigrants | Argentina | 100.0 /100 | #29 | Exceptional 10.6% |
| Immigrants | Turkey | 100.0 /100 | #30 | Exceptional 10.6% |
| Immigrants | Egypt | 100.0 /100 | #31 | Exceptional 10.6% |
| Paraguayans | 100.0 /100 | #32 | Exceptional 10.6% |
| Immigrants | Kuwait | 100.0 /100 | #33 | Exceptional 10.7% |
| Immigrants | Ethiopia | 100.0 /100 | #34 | Exceptional 10.7% |
Demographics Similar to Inupiat by Disability
In terms of disability, the demographic groups most similar to Inupiat are West Indian (12.2%, a difference of 0.020%), Samoan (12.2%, a difference of 0.080%), Malaysian (12.2%, a difference of 0.11%), Italian (12.2%, a difference of 0.12%), and Alsatian (12.1%, a difference of 0.16%).
| Demographics | Rating | Rank | Disability |
| Spanish American Indians | 4.1 /100 | #222 | Tragic 12.1% |
| Hispanics or Latinos | 3.9 /100 | #223 | Tragic 12.1% |
| Mexicans | 3.7 /100 | #224 | Tragic 12.1% |
| Senegalese | 3.5 /100 | #225 | Tragic 12.1% |
| Jamaicans | 3.3 /100 | #226 | Tragic 12.1% |
| Alsatians | 3.3 /100 | #227 | Tragic 12.1% |
| West Indians | 2.9 /100 | #228 | Tragic 12.2% |
| Inupiat | 2.8 /100 | #229 | Tragic 12.2% |
| Samoans | 2.6 /100 | #230 | Tragic 12.2% |
| Malaysians | 2.5 /100 | #231 | Tragic 12.2% |
| Italians | 2.5 /100 | #232 | Tragic 12.2% |
| Bahamians | 2.3 /100 | #233 | Tragic 12.2% |
| Japanese | 2.3 /100 | #234 | Tragic 12.2% |
| Yup'ik | 2.2 /100 | #235 | Tragic 12.2% |
| Chinese | 2.0 /100 | #236 | Tragic 12.2% |