Potawatomi vs Basque Disability
COMPARE
Potawatomi
Basque
Disability
Disability Comparison
Potawatomi
Basques
14.2%
DISABILITY
0.0/ 100
METRIC RATING
329th/ 347
METRIC RANK
12.2%
DISABILITY
1.5/ 100
METRIC RATING
244th/ 347
METRIC RANK
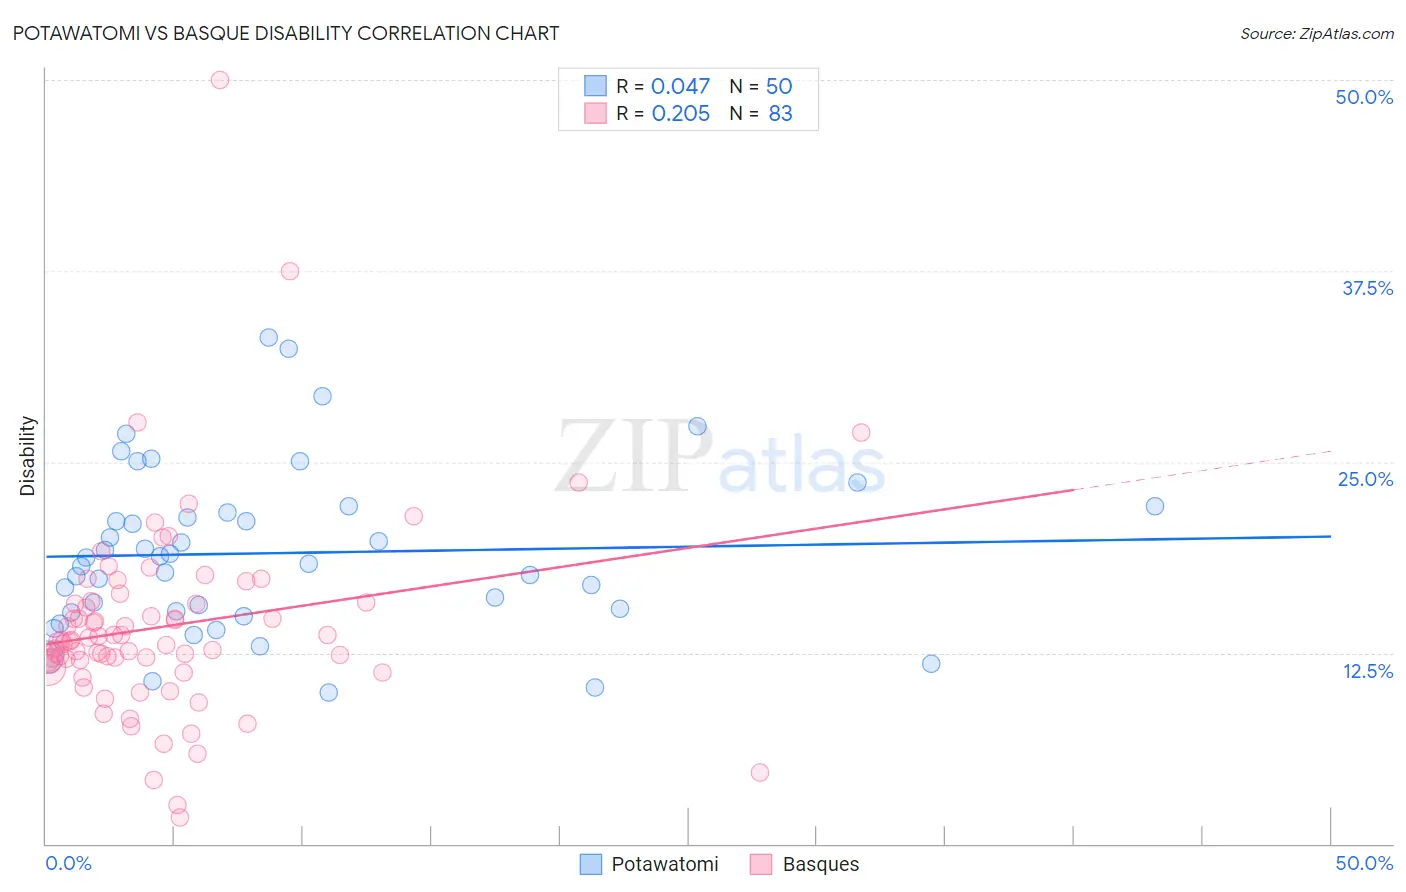
Potawatomi vs Basque Disability Correlation Chart
The statistical analysis conducted on geographies consisting of 117,767,457 people shows no correlation between the proportion of Potawatomi and percentage of population with a disability in the United States with a correlation coefficient (R) of 0.047 and weighted average of 14.2%. Similarly, the statistical analysis conducted on geographies consisting of 165,778,985 people shows a weak positive correlation between the proportion of Basques and percentage of population with a disability in the United States with a correlation coefficient (R) of 0.205 and weighted average of 12.2%, a difference of 15.8%.
Disability Correlation Summary
| Measurement | Potawatomi | Basque |
| Minimum | 9.9% | 1.7% |
| Maximum | 33.1% | 50.0% |
| Range | 23.2% | 48.3% |
| Mean | 19.0% | 14.2% |
| Median | 18.5% | 13.3% |
| Interquartile 25% (IQ1) | 15.2% | 11.7% |
| Interquartile 75% (IQ3) | 21.7% | 15.8% |
| Interquartile Range (IQR) | 6.5% | 4.1% |
| Standard Deviation (Sample) | 5.4% | 6.6% |
| Standard Deviation (Population) | 5.3% | 6.6% |
Similar Demographics by Disability
Demographics Similar to Potawatomi by Disability
In terms of disability, the demographic groups most similar to Potawatomi are Ottawa (14.2%, a difference of 0.12%), Immigrants from the Azores (14.2%, a difference of 0.12%), Osage (14.2%, a difference of 0.14%), Native/Alaskan (14.2%, a difference of 0.17%), and Chippewa (14.1%, a difference of 0.22%).
| Demographics | Rating | Rank | Disability |
| Americans | 0.0 /100 | #322 | Tragic 13.9% |
| Comanche | 0.0 /100 | #323 | Tragic 14.1% |
| Chippewa | 0.0 /100 | #324 | Tragic 14.1% |
| Natives/Alaskans | 0.0 /100 | #325 | Tragic 14.2% |
| Osage | 0.0 /100 | #326 | Tragic 14.2% |
| Ottawa | 0.0 /100 | #327 | Tragic 14.2% |
| Immigrants | Azores | 0.0 /100 | #328 | Tragic 14.2% |
| Potawatomi | 0.0 /100 | #329 | Tragic 14.2% |
| Navajo | 0.0 /100 | #330 | Tragic 14.3% |
| Alaskan Athabascans | 0.0 /100 | #331 | Tragic 14.4% |
| Pueblo | 0.0 /100 | #332 | Tragic 14.4% |
| Cajuns | 0.0 /100 | #333 | Tragic 14.6% |
| Yuman | 0.0 /100 | #334 | Tragic 14.6% |
| Tohono O'odham | 0.0 /100 | #335 | Tragic 14.8% |
| Cherokee | 0.0 /100 | #336 | Tragic 14.8% |
Demographics Similar to Basques by Disability
In terms of disability, the demographic groups most similar to Basques are British (12.2%, a difference of 0.0%), Liberian (12.2%, a difference of 0.020%), Swiss (12.2%, a difference of 0.040%), Indonesian (12.2%, a difference of 0.070%), and Polish (12.2%, a difference of 0.090%).
| Demographics | Rating | Rank | Disability |
| Immigrants | Congo | 1.9 /100 | #237 | Tragic 12.2% |
| Norwegians | 1.9 /100 | #238 | Tragic 12.2% |
| Swedes | 1.8 /100 | #239 | Tragic 12.2% |
| Hungarians | 1.7 /100 | #240 | Tragic 12.2% |
| Yugoslavians | 1.7 /100 | #241 | Tragic 12.2% |
| Poles | 1.7 /100 | #242 | Tragic 12.2% |
| British | 1.5 /100 | #243 | Tragic 12.2% |
| Basques | 1.5 /100 | #244 | Tragic 12.2% |
| Liberians | 1.5 /100 | #245 | Tragic 12.2% |
| Swiss | 1.5 /100 | #246 | Tragic 12.2% |
| Indonesians | 1.4 /100 | #247 | Tragic 12.2% |
| Guamanians/Chamorros | 1.4 /100 | #248 | Tragic 12.3% |
| Carpatho Rusyns | 1.4 /100 | #249 | Tragic 12.3% |
| Sub-Saharan Africans | 1.4 /100 | #250 | Tragic 12.3% |
| Europeans | 1.4 /100 | #251 | Tragic 12.3% |