Potawatomi vs Hmong Disability
COMPARE
Potawatomi
Hmong
Disability
Disability Comparison
Potawatomi
Hmong
14.2%
DISABILITY
0.0/ 100
METRIC RATING
329th/ 347
METRIC RANK
12.8%
DISABILITY
0.0/ 100
METRIC RATING
276th/ 347
METRIC RANK
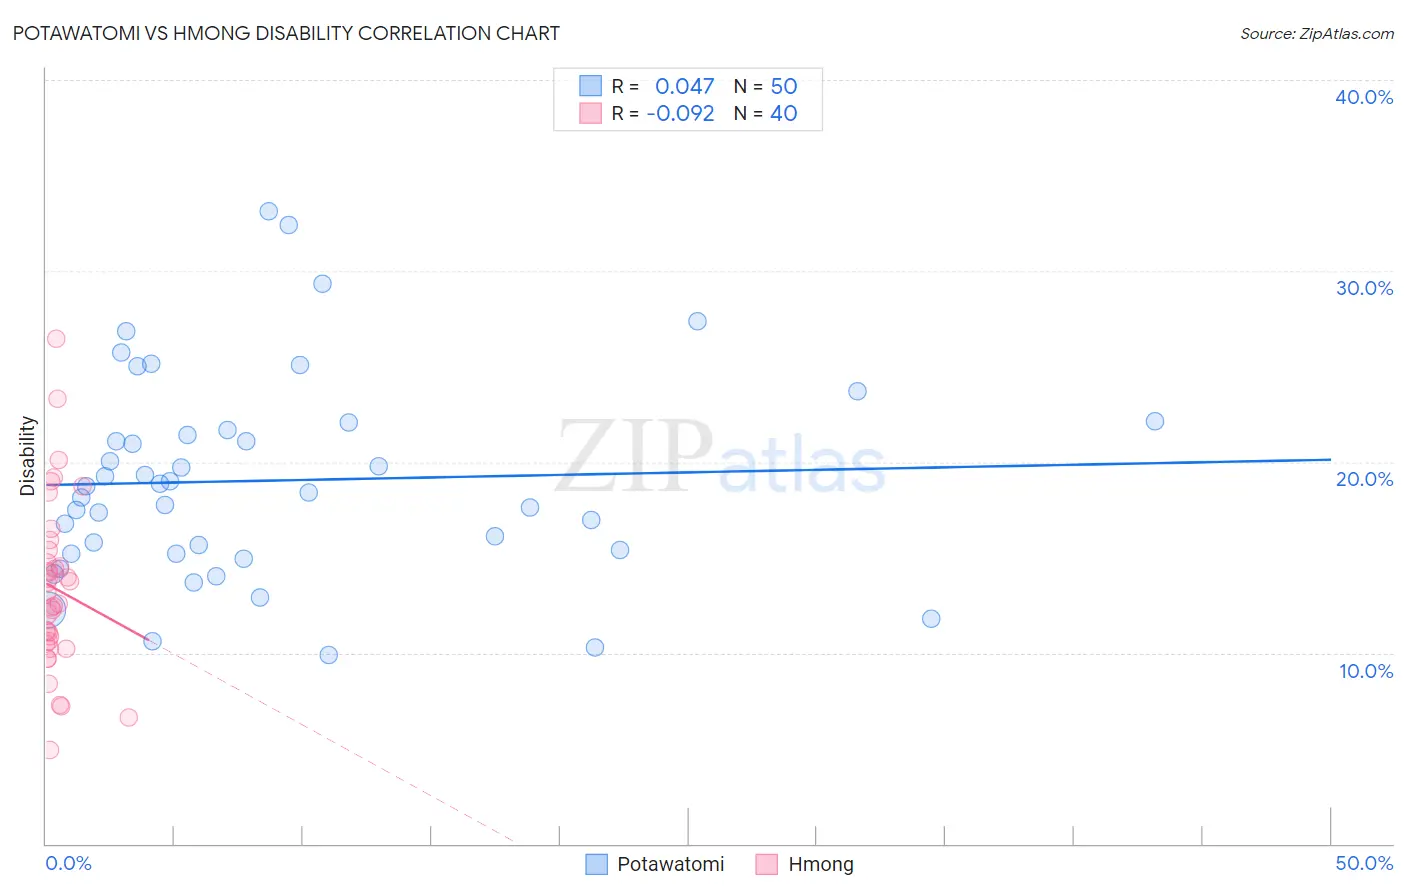
Potawatomi vs Hmong Disability Correlation Chart
The statistical analysis conducted on geographies consisting of 117,767,457 people shows no correlation between the proportion of Potawatomi and percentage of population with a disability in the United States with a correlation coefficient (R) of 0.047 and weighted average of 14.2%. Similarly, the statistical analysis conducted on geographies consisting of 24,681,537 people shows a slight negative correlation between the proportion of Hmong and percentage of population with a disability in the United States with a correlation coefficient (R) of -0.092 and weighted average of 12.8%, a difference of 10.8%.
Disability Correlation Summary
| Measurement | Potawatomi | Hmong |
| Minimum | 9.9% | 4.9% |
| Maximum | 33.1% | 26.4% |
| Range | 23.2% | 21.5% |
| Mean | 19.0% | 13.4% |
| Median | 18.5% | 12.8% |
| Interquartile 25% (IQ1) | 15.2% | 10.5% |
| Interquartile 75% (IQ3) | 21.7% | 15.1% |
| Interquartile Range (IQR) | 6.5% | 4.5% |
| Standard Deviation (Sample) | 5.4% | 4.4% |
| Standard Deviation (Population) | 5.3% | 4.4% |
Similar Demographics by Disability
Demographics Similar to Potawatomi by Disability
In terms of disability, the demographic groups most similar to Potawatomi are Ottawa (14.2%, a difference of 0.12%), Immigrants from the Azores (14.2%, a difference of 0.12%), Osage (14.2%, a difference of 0.14%), Native/Alaskan (14.2%, a difference of 0.17%), and Chippewa (14.1%, a difference of 0.22%).
| Demographics | Rating | Rank | Disability |
| Americans | 0.0 /100 | #322 | Tragic 13.9% |
| Comanche | 0.0 /100 | #323 | Tragic 14.1% |
| Chippewa | 0.0 /100 | #324 | Tragic 14.1% |
| Natives/Alaskans | 0.0 /100 | #325 | Tragic 14.2% |
| Osage | 0.0 /100 | #326 | Tragic 14.2% |
| Ottawa | 0.0 /100 | #327 | Tragic 14.2% |
| Immigrants | Azores | 0.0 /100 | #328 | Tragic 14.2% |
| Potawatomi | 0.0 /100 | #329 | Tragic 14.2% |
| Navajo | 0.0 /100 | #330 | Tragic 14.3% |
| Alaskan Athabascans | 0.0 /100 | #331 | Tragic 14.4% |
| Pueblo | 0.0 /100 | #332 | Tragic 14.4% |
| Cajuns | 0.0 /100 | #333 | Tragic 14.6% |
| Yuman | 0.0 /100 | #334 | Tragic 14.6% |
| Tohono O'odham | 0.0 /100 | #335 | Tragic 14.8% |
| Cherokee | 0.0 /100 | #336 | Tragic 14.8% |
Demographics Similar to Hmong by Disability
In terms of disability, the demographic groups most similar to Hmong are Dutch (12.8%, a difference of 0.050%), Sioux (12.8%, a difference of 0.15%), German (12.8%, a difference of 0.22%), Nepalese (12.8%, a difference of 0.23%), and Fijian (12.8%, a difference of 0.31%).
| Demographics | Rating | Rank | Disability |
| Immigrants | Dominican Republic | 0.1 /100 | #269 | Tragic 12.6% |
| Portuguese | 0.1 /100 | #270 | Tragic 12.6% |
| Immigrants | Yemen | 0.1 /100 | #271 | Tragic 12.6% |
| Dominicans | 0.0 /100 | #272 | Tragic 12.7% |
| Finns | 0.0 /100 | #273 | Tragic 12.7% |
| Nepalese | 0.0 /100 | #274 | Tragic 12.8% |
| Sioux | 0.0 /100 | #275 | Tragic 12.8% |
| Hmong | 0.0 /100 | #276 | Tragic 12.8% |
| Dutch | 0.0 /100 | #277 | Tragic 12.8% |
| Germans | 0.0 /100 | #278 | Tragic 12.8% |
| Fijians | 0.0 /100 | #279 | Tragic 12.8% |
| Spanish | 0.0 /100 | #280 | Tragic 12.8% |
| Immigrants | Portugal | 0.0 /100 | #281 | Tragic 12.9% |
| Scottish | 0.0 /100 | #282 | Tragic 12.9% |
| Irish | 0.0 /100 | #283 | Tragic 12.9% |