Pima vs Belgian Ambulatory Disability
COMPARE
Pima
Belgian
Ambulatory Disability
Ambulatory Disability Comparison
Pima
Belgians
8.2%
AMBULATORY DISABILITY
0.0/ 100
METRIC RATING
339th/ 347
METRIC RANK
6.2%
AMBULATORY DISABILITY
28.6/ 100
METRIC RATING
195th/ 347
METRIC RANK
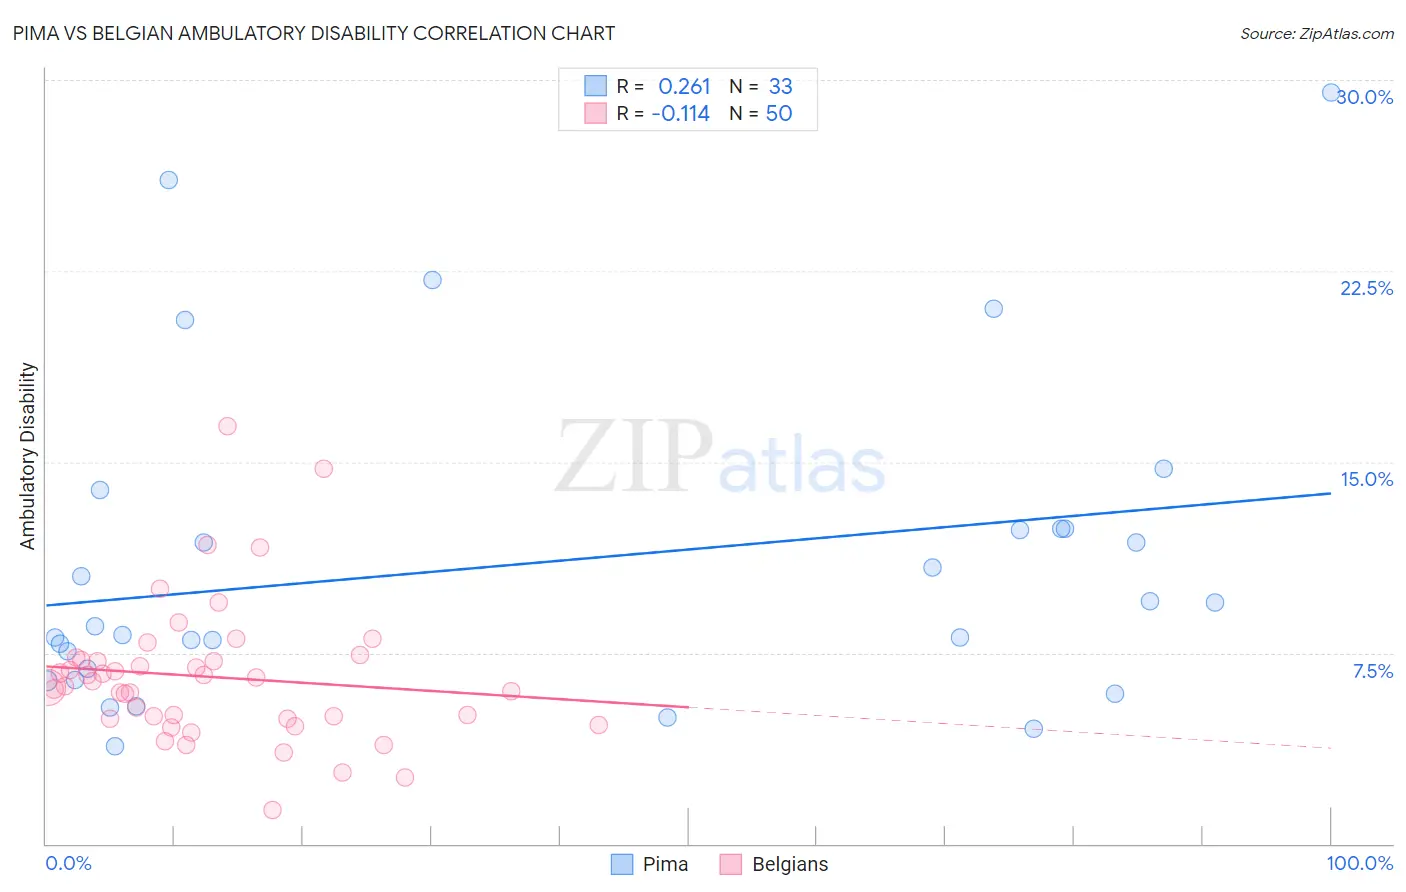
Pima vs Belgian Ambulatory Disability Correlation Chart
The statistical analysis conducted on geographies consisting of 61,538,415 people shows a weak positive correlation between the proportion of Pima and percentage of population with ambulatory disability in the United States with a correlation coefficient (R) of 0.261 and weighted average of 8.2%. Similarly, the statistical analysis conducted on geographies consisting of 355,928,519 people shows a poor negative correlation between the proportion of Belgians and percentage of population with ambulatory disability in the United States with a correlation coefficient (R) of -0.114 and weighted average of 6.2%, a difference of 33.2%.
Ambulatory Disability Correlation Summary
| Measurement | Pima | Belgian |
| Minimum | 3.8% | 1.3% |
| Maximum | 29.5% | 16.4% |
| Range | 25.7% | 15.1% |
| Mean | 11.0% | 6.6% |
| Median | 8.6% | 6.3% |
| Interquartile 25% (IQ1) | 6.7% | 4.9% |
| Interquartile 75% (IQ3) | 12.4% | 7.2% |
| Interquartile Range (IQR) | 5.7% | 2.3% |
| Standard Deviation (Sample) | 6.3% | 2.8% |
| Standard Deviation (Population) | 6.2% | 2.7% |
Similar Demographics by Ambulatory Disability
Demographics Similar to Pima by Ambulatory Disability
In terms of ambulatory disability, the demographic groups most similar to Pima are Colville (8.2%, a difference of 0.35%), Choctaw (8.3%, a difference of 0.83%), Dutch West Indian (8.2%, a difference of 0.92%), Creek (8.5%, a difference of 2.5%), and Seminole (8.0%, a difference of 2.6%).
| Demographics | Rating | Rank | Ambulatory Disability |
| Menominee | 0.0 /100 | #332 | Tragic 7.8% |
| Cherokee | 0.0 /100 | #333 | Tragic 7.9% |
| Yuman | 0.0 /100 | #334 | Tragic 7.9% |
| Chickasaw | 0.0 /100 | #335 | Tragic 8.0% |
| Seminole | 0.0 /100 | #336 | Tragic 8.0% |
| Dutch West Indians | 0.0 /100 | #337 | Tragic 8.2% |
| Colville | 0.0 /100 | #338 | Tragic 8.2% |
| Pima | 0.0 /100 | #339 | Tragic 8.2% |
| Choctaw | 0.0 /100 | #340 | Tragic 8.3% |
| Creek | 0.0 /100 | #341 | Tragic 8.5% |
| Kiowa | 0.0 /100 | #342 | Tragic 8.6% |
| Tohono O'odham | 0.0 /100 | #343 | Tragic 8.7% |
| Tsimshian | 0.0 /100 | #344 | Tragic 8.8% |
| Puerto Ricans | 0.0 /100 | #345 | Tragic 8.9% |
| Houma | 0.0 /100 | #346 | Tragic 9.3% |
Demographics Similar to Belgians by Ambulatory Disability
In terms of ambulatory disability, the demographic groups most similar to Belgians are Malaysian (6.2%, a difference of 0.030%), Guatemalan (6.2%, a difference of 0.080%), Alaska Native (6.2%, a difference of 0.080%), Polish (6.2%, a difference of 0.15%), and Immigrants from Western Europe (6.2%, a difference of 0.19%).
| Demographics | Rating | Rank | Ambulatory Disability |
| British | 34.3 /100 | #188 | Fair 6.2% |
| Ukrainians | 34.0 /100 | #189 | Fair 6.2% |
| Immigrants | Western Africa | 33.4 /100 | #190 | Fair 6.2% |
| Immigrants | Guatemala | 31.9 /100 | #191 | Fair 6.2% |
| Immigrants | Western Europe | 31.6 /100 | #192 | Fair 6.2% |
| Guatemalans | 30.0 /100 | #193 | Fair 6.2% |
| Alaska Natives | 29.8 /100 | #194 | Fair 6.2% |
| Belgians | 28.6 /100 | #195 | Fair 6.2% |
| Malaysians | 28.2 /100 | #196 | Fair 6.2% |
| Poles | 26.3 /100 | #197 | Fair 6.2% |
| Immigrants | Bangladesh | 24.6 /100 | #198 | Fair 6.2% |
| Italians | 22.6 /100 | #199 | Fair 6.2% |
| Immigrants | Cambodia | 21.5 /100 | #200 | Fair 6.2% |
| Immigrants | Central America | 20.1 /100 | #201 | Fair 6.2% |
| Albanians | 19.7 /100 | #202 | Poor 6.2% |