Immigrants from Australia vs Belgian Ambulatory Disability
COMPARE
Immigrants from Australia
Belgian
Ambulatory Disability
Ambulatory Disability Comparison
Immigrants from Australia
Belgians
5.5%
AMBULATORY DISABILITY
100.0/ 100
METRIC RATING
32nd/ 347
METRIC RANK
6.2%
AMBULATORY DISABILITY
28.6/ 100
METRIC RATING
195th/ 347
METRIC RANK
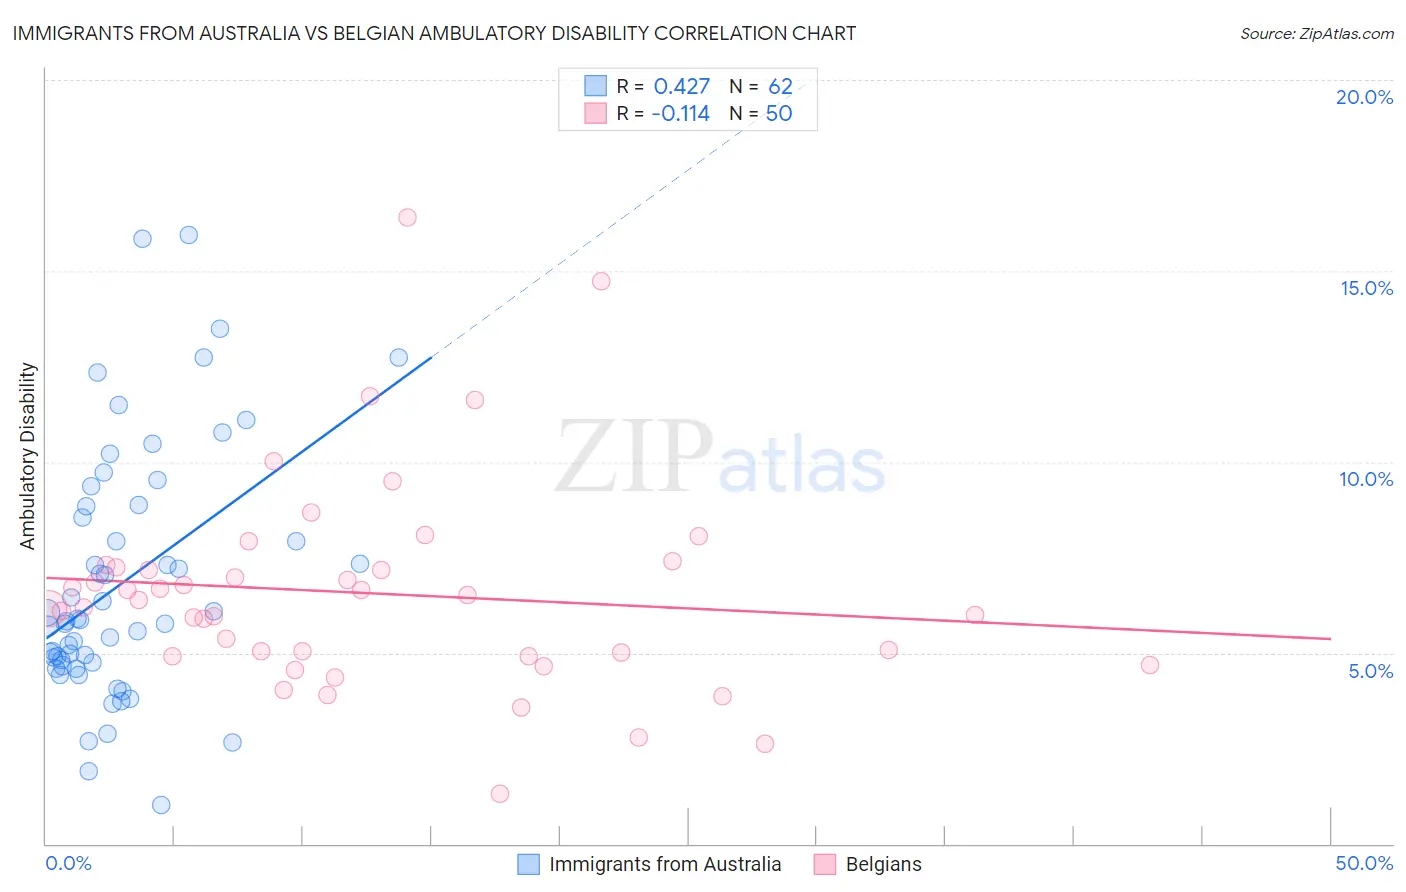
Immigrants from Australia vs Belgian Ambulatory Disability Correlation Chart
The statistical analysis conducted on geographies consisting of 227,168,976 people shows a moderate positive correlation between the proportion of Immigrants from Australia and percentage of population with ambulatory disability in the United States with a correlation coefficient (R) of 0.427 and weighted average of 5.5%. Similarly, the statistical analysis conducted on geographies consisting of 355,928,519 people shows a poor negative correlation between the proportion of Belgians and percentage of population with ambulatory disability in the United States with a correlation coefficient (R) of -0.114 and weighted average of 6.2%, a difference of 13.5%.
Ambulatory Disability Correlation Summary
| Measurement | Immigrants from Australia | Belgian |
| Minimum | 1.0% | 1.3% |
| Maximum | 15.9% | 16.4% |
| Range | 14.9% | 15.1% |
| Mean | 6.8% | 6.6% |
| Median | 5.8% | 6.3% |
| Interquartile 25% (IQ1) | 4.7% | 4.9% |
| Interquartile 75% (IQ3) | 8.9% | 7.2% |
| Interquartile Range (IQR) | 4.1% | 2.3% |
| Standard Deviation (Sample) | 3.3% | 2.8% |
| Standard Deviation (Population) | 3.2% | 2.7% |
Similar Demographics by Ambulatory Disability
Demographics Similar to Immigrants from Australia by Ambulatory Disability
In terms of ambulatory disability, the demographic groups most similar to Immigrants from Australia are Immigrants from Pakistan (5.5%, a difference of 0.12%), Immigrants from Venezuela (5.4%, a difference of 0.17%), Immigrants from Turkey (5.4%, a difference of 0.19%), Immigrants from Asia (5.5%, a difference of 0.28%), and Afghan (5.5%, a difference of 0.32%).
| Demographics | Rating | Rank | Ambulatory Disability |
| Zimbabweans | 100.0 /100 | #25 | Exceptional 5.4% |
| Immigrants | Nepal | 100.0 /100 | #26 | Exceptional 5.4% |
| Asians | 100.0 /100 | #27 | Exceptional 5.4% |
| Cambodians | 100.0 /100 | #28 | Exceptional 5.4% |
| Immigrants | Iran | 100.0 /100 | #29 | Exceptional 5.4% |
| Immigrants | Turkey | 100.0 /100 | #30 | Exceptional 5.4% |
| Immigrants | Venezuela | 100.0 /100 | #31 | Exceptional 5.4% |
| Immigrants | Australia | 100.0 /100 | #32 | Exceptional 5.5% |
| Immigrants | Pakistan | 100.0 /100 | #33 | Exceptional 5.5% |
| Immigrants | Asia | 100.0 /100 | #34 | Exceptional 5.5% |
| Afghans | 100.0 /100 | #35 | Exceptional 5.5% |
| Immigrants | Malaysia | 100.0 /100 | #36 | Exceptional 5.5% |
| Turks | 100.0 /100 | #37 | Exceptional 5.5% |
| Cypriots | 100.0 /100 | #38 | Exceptional 5.5% |
| Immigrants | Eritrea | 100.0 /100 | #39 | Exceptional 5.5% |
Demographics Similar to Belgians by Ambulatory Disability
In terms of ambulatory disability, the demographic groups most similar to Belgians are Malaysian (6.2%, a difference of 0.030%), Guatemalan (6.2%, a difference of 0.080%), Alaska Native (6.2%, a difference of 0.080%), Polish (6.2%, a difference of 0.15%), and Immigrants from Western Europe (6.2%, a difference of 0.19%).
| Demographics | Rating | Rank | Ambulatory Disability |
| British | 34.3 /100 | #188 | Fair 6.2% |
| Ukrainians | 34.0 /100 | #189 | Fair 6.2% |
| Immigrants | Western Africa | 33.4 /100 | #190 | Fair 6.2% |
| Immigrants | Guatemala | 31.9 /100 | #191 | Fair 6.2% |
| Immigrants | Western Europe | 31.6 /100 | #192 | Fair 6.2% |
| Guatemalans | 30.0 /100 | #193 | Fair 6.2% |
| Alaska Natives | 29.8 /100 | #194 | Fair 6.2% |
| Belgians | 28.6 /100 | #195 | Fair 6.2% |
| Malaysians | 28.2 /100 | #196 | Fair 6.2% |
| Poles | 26.3 /100 | #197 | Fair 6.2% |
| Immigrants | Bangladesh | 24.6 /100 | #198 | Fair 6.2% |
| Italians | 22.6 /100 | #199 | Fair 6.2% |
| Immigrants | Cambodia | 21.5 /100 | #200 | Fair 6.2% |
| Immigrants | Central America | 20.1 /100 | #201 | Fair 6.2% |
| Albanians | 19.7 /100 | #202 | Poor 6.2% |