Vietnamese vs Belgian Ambulatory Disability
COMPARE
Vietnamese
Belgian
Ambulatory Disability
Ambulatory Disability Comparison
Vietnamese
Belgians
6.1%
AMBULATORY DISABILITY
47.2/ 100
METRIC RATING
175th/ 347
METRIC RANK
6.2%
AMBULATORY DISABILITY
28.6/ 100
METRIC RATING
195th/ 347
METRIC RANK
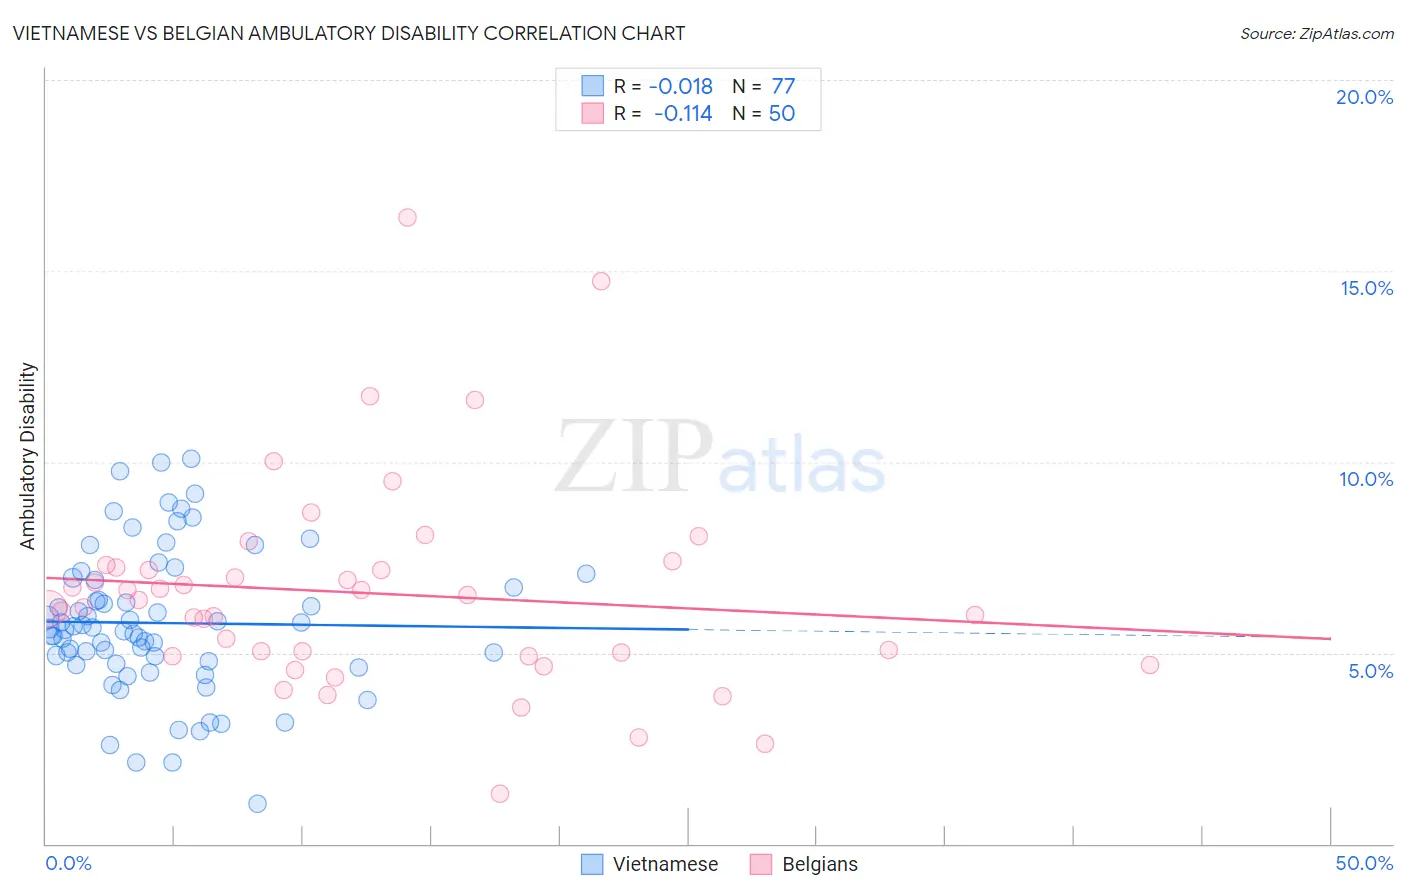
Vietnamese vs Belgian Ambulatory Disability Correlation Chart
The statistical analysis conducted on geographies consisting of 170,721,676 people shows no correlation between the proportion of Vietnamese and percentage of population with ambulatory disability in the United States with a correlation coefficient (R) of -0.018 and weighted average of 6.1%. Similarly, the statistical analysis conducted on geographies consisting of 355,928,519 people shows a poor negative correlation between the proportion of Belgians and percentage of population with ambulatory disability in the United States with a correlation coefficient (R) of -0.114 and weighted average of 6.2%, a difference of 1.1%.
Ambulatory Disability Correlation Summary
| Measurement | Vietnamese | Belgian |
| Minimum | 1.1% | 1.3% |
| Maximum | 10.1% | 16.4% |
| Range | 9.0% | 15.1% |
| Mean | 5.8% | 6.6% |
| Median | 5.6% | 6.3% |
| Interquartile 25% (IQ1) | 4.7% | 4.9% |
| Interquartile 75% (IQ3) | 6.9% | 7.2% |
| Interquartile Range (IQR) | 2.2% | 2.3% |
| Standard Deviation (Sample) | 1.9% | 2.8% |
| Standard Deviation (Population) | 1.9% | 2.7% |
Demographics Similar to Vietnamese and Belgians by Ambulatory Disability
In terms of ambulatory disability, the demographic groups most similar to Vietnamese are Immigrants from North America (6.1%, a difference of 0.090%), Immigrants from England (6.1%, a difference of 0.10%), Scandinavian (6.1%, a difference of 0.14%), Austrian (6.1%, a difference of 0.17%), and Immigrants from Nicaragua (6.1%, a difference of 0.17%). Similarly, the demographic groups most similar to Belgians are Guatemalan (6.2%, a difference of 0.080%), Alaska Native (6.2%, a difference of 0.080%), Immigrants from Western Europe (6.2%, a difference of 0.19%), Immigrants from Guatemala (6.2%, a difference of 0.20%), and Immigrants from Western Africa (6.2%, a difference of 0.29%).
| Demographics | Rating | Rank | Ambulatory Disability |
| Vietnamese | 47.2 /100 | #175 | Average 6.1% |
| Immigrants | North America | 45.6 /100 | #176 | Average 6.1% |
| Immigrants | England | 45.4 /100 | #177 | Average 6.1% |
| Scandinavians | 44.5 /100 | #178 | Average 6.1% |
| Austrians | 44.1 /100 | #179 | Average 6.1% |
| Immigrants | Nicaragua | 43.9 /100 | #180 | Average 6.1% |
| Swiss | 43.1 /100 | #181 | Average 6.1% |
| Serbians | 42.8 /100 | #182 | Average 6.1% |
| Immigrants | Thailand | 42.2 /100 | #183 | Average 6.1% |
| Immigrants | Ghana | 41.2 /100 | #184 | Average 6.1% |
| Immigrants | Bosnia and Herzegovina | 37.2 /100 | #185 | Fair 6.2% |
| Europeans | 36.2 /100 | #186 | Fair 6.2% |
| Carpatho Rusyns | 35.3 /100 | #187 | Fair 6.2% |
| British | 34.3 /100 | #188 | Fair 6.2% |
| Ukrainians | 34.0 /100 | #189 | Fair 6.2% |
| Immigrants | Western Africa | 33.4 /100 | #190 | Fair 6.2% |
| Immigrants | Guatemala | 31.9 /100 | #191 | Fair 6.2% |
| Immigrants | Western Europe | 31.6 /100 | #192 | Fair 6.2% |
| Guatemalans | 30.0 /100 | #193 | Fair 6.2% |
| Alaska Natives | 29.8 /100 | #194 | Fair 6.2% |
| Belgians | 28.6 /100 | #195 | Fair 6.2% |