Pima vs Belgian Vision Disability
COMPARE
Pima
Belgian
Vision Disability
Vision Disability Comparison
Pima
Belgians
3.3%
VISION DISABILITY
0.0/ 100
METRIC RATING
343rd/ 347
METRIC RANK
2.1%
VISION DISABILITY
75.9/ 100
METRIC RATING
150th/ 347
METRIC RANK
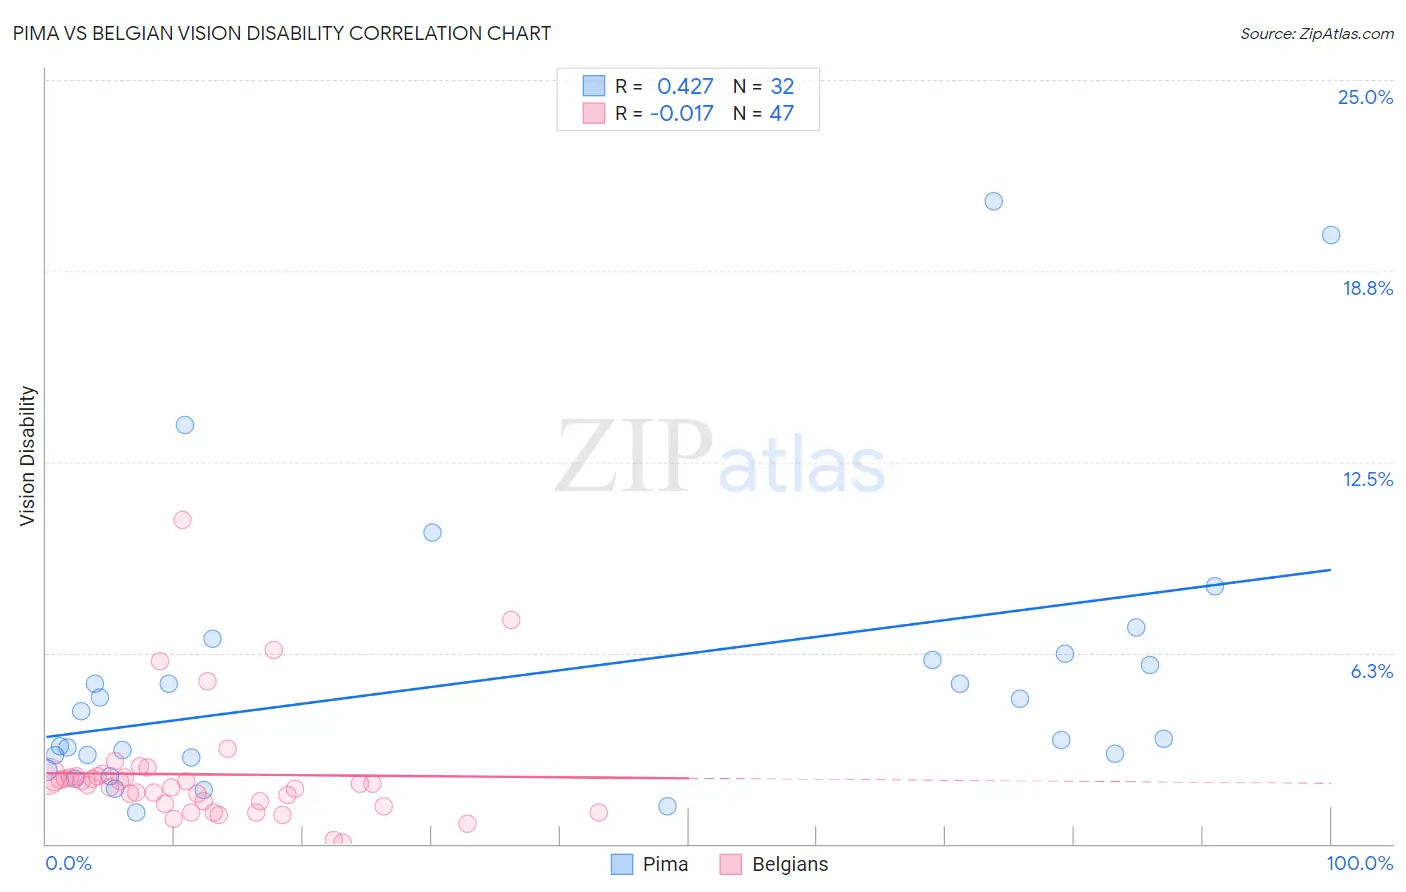
Pima vs Belgian Vision Disability Correlation Chart
The statistical analysis conducted on geographies consisting of 61,535,675 people shows a moderate positive correlation between the proportion of Pima and percentage of population with vision disability in the United States with a correlation coefficient (R) of 0.427 and weighted average of 3.3%. Similarly, the statistical analysis conducted on geographies consisting of 355,727,371 people shows no correlation between the proportion of Belgians and percentage of population with vision disability in the United States with a correlation coefficient (R) of -0.017 and weighted average of 2.1%, a difference of 56.6%.
Vision Disability Correlation Summary
| Measurement | Pima | Belgian |
| Minimum | 1.0% | 0.061% |
| Maximum | 21.0% | 10.6% |
| Range | 20.0% | 10.5% |
| Mean | 5.5% | 2.3% |
| Median | 3.9% | 2.0% |
| Interquartile 25% (IQ1) | 2.9% | 1.3% |
| Interquartile 75% (IQ3) | 6.1% | 2.2% |
| Interquartile Range (IQR) | 3.3% | 0.89% |
| Standard Deviation (Sample) | 4.8% | 1.9% |
| Standard Deviation (Population) | 4.7% | 1.9% |
Similar Demographics by Vision Disability
Demographics Similar to Pima by Vision Disability
In terms of vision disability, the demographic groups most similar to Pima are Pueblo (3.3%, a difference of 0.030%), Choctaw (3.3%, a difference of 1.1%), Lumbee (3.4%, a difference of 1.6%), Kiowa (3.3%, a difference of 2.5%), and Houma (3.4%, a difference of 3.3%).
| Demographics | Rating | Rank | Vision Disability |
| Cajuns | 0.0 /100 | #333 | Tragic 3.1% |
| Cheyenne | 0.0 /100 | #334 | Tragic 3.1% |
| Navajo | 0.0 /100 | #335 | Tragic 3.1% |
| Alaskan Athabascans | 0.0 /100 | #336 | Tragic 3.1% |
| Dutch West Indians | 0.0 /100 | #337 | Tragic 3.2% |
| Chickasaw | 0.0 /100 | #338 | Tragic 3.2% |
| Tsimshian | 0.0 /100 | #339 | Tragic 3.2% |
| Creek | 0.0 /100 | #340 | Tragic 3.2% |
| Kiowa | 0.0 /100 | #341 | Tragic 3.3% |
| Choctaw | 0.0 /100 | #342 | Tragic 3.3% |
| Pima | 0.0 /100 | #343 | Tragic 3.3% |
| Pueblo | 0.0 /100 | #344 | Tragic 3.3% |
| Lumbee | 0.0 /100 | #345 | Tragic 3.4% |
| Houma | 0.0 /100 | #346 | Tragic 3.4% |
| Puerto Ricans | 0.0 /100 | #347 | Tragic 3.9% |
Demographics Similar to Belgians by Vision Disability
In terms of vision disability, the demographic groups most similar to Belgians are Colombian (2.1%, a difference of 0.030%), Immigrants from Norway (2.1%, a difference of 0.040%), Immigrants from Southern Europe (2.1%, a difference of 0.11%), Immigrants from South America (2.1%, a difference of 0.18%), and Slovene (2.1%, a difference of 0.19%).
| Demographics | Rating | Rank | Vision Disability |
| Immigrants | Sierra Leone | 82.8 /100 | #143 | Excellent 2.1% |
| Ukrainians | 81.9 /100 | #144 | Excellent 2.1% |
| Immigrants | Bosnia and Herzegovina | 81.5 /100 | #145 | Excellent 2.1% |
| Italians | 79.7 /100 | #146 | Good 2.1% |
| Immigrants | Sudan | 78.4 /100 | #147 | Good 2.1% |
| Finns | 78.3 /100 | #148 | Good 2.1% |
| Colombians | 76.2 /100 | #149 | Good 2.1% |
| Belgians | 75.9 /100 | #150 | Good 2.1% |
| Immigrants | Norway | 75.5 /100 | #151 | Good 2.1% |
| Immigrants | Southern Europe | 74.6 /100 | #152 | Good 2.1% |
| Immigrants | South America | 73.8 /100 | #153 | Good 2.1% |
| Slovenes | 73.6 /100 | #154 | Good 2.1% |
| Immigrants | Colombia | 72.1 /100 | #155 | Good 2.1% |
| Pakistanis | 71.6 /100 | #156 | Good 2.1% |
| Serbians | 70.2 /100 | #157 | Good 2.1% |