Pima vs South American Indian Ambulatory Disability
COMPARE
Pima
South American Indian
Ambulatory Disability
Ambulatory Disability Comparison
Pima
South American Indians
8.2%
AMBULATORY DISABILITY
0.0/ 100
METRIC RATING
339th/ 347
METRIC RANK
5.9%
AMBULATORY DISABILITY
94.8/ 100
METRIC RATING
115th/ 347
METRIC RANK
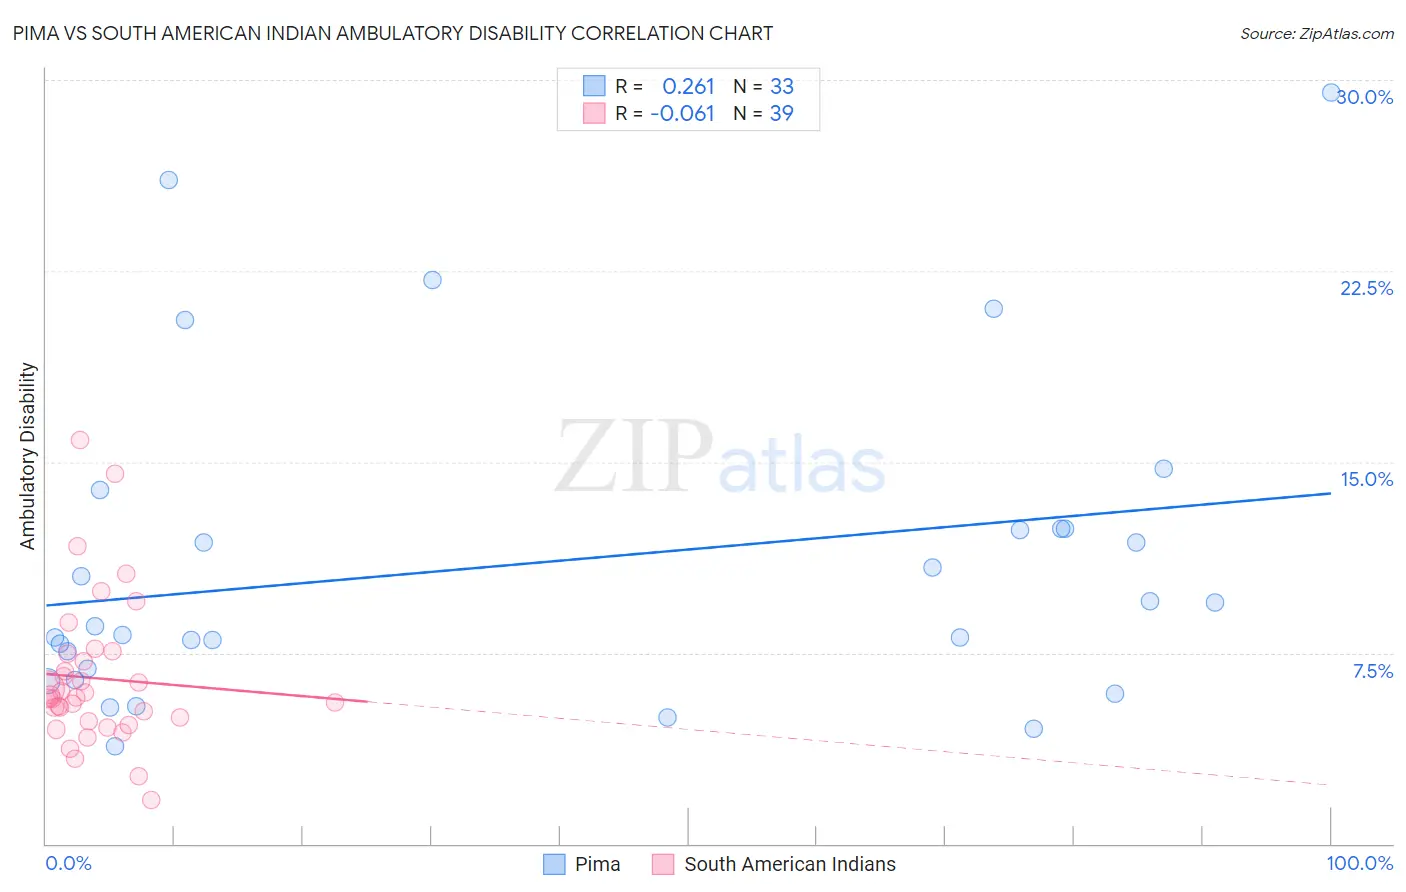
Pima vs South American Indian Ambulatory Disability Correlation Chart
The statistical analysis conducted on geographies consisting of 61,538,415 people shows a weak positive correlation between the proportion of Pima and percentage of population with ambulatory disability in the United States with a correlation coefficient (R) of 0.261 and weighted average of 8.2%. Similarly, the statistical analysis conducted on geographies consisting of 164,560,869 people shows a slight negative correlation between the proportion of South American Indians and percentage of population with ambulatory disability in the United States with a correlation coefficient (R) of -0.061 and weighted average of 5.9%, a difference of 40.2%.
Ambulatory Disability Correlation Summary
| Measurement | Pima | South American Indian |
| Minimum | 3.8% | 1.7% |
| Maximum | 29.5% | 15.9% |
| Range | 25.7% | 14.2% |
| Mean | 11.0% | 6.5% |
| Median | 8.6% | 5.7% |
| Interquartile 25% (IQ1) | 6.7% | 4.8% |
| Interquartile 75% (IQ3) | 12.4% | 7.5% |
| Interquartile Range (IQR) | 5.7% | 2.7% |
| Standard Deviation (Sample) | 6.3% | 2.9% |
| Standard Deviation (Population) | 6.2% | 2.9% |
Similar Demographics by Ambulatory Disability
Demographics Similar to Pima by Ambulatory Disability
In terms of ambulatory disability, the demographic groups most similar to Pima are Colville (8.2%, a difference of 0.35%), Choctaw (8.3%, a difference of 0.83%), Dutch West Indian (8.2%, a difference of 0.92%), Creek (8.5%, a difference of 2.5%), and Seminole (8.0%, a difference of 2.6%).
| Demographics | Rating | Rank | Ambulatory Disability |
| Menominee | 0.0 /100 | #332 | Tragic 7.8% |
| Cherokee | 0.0 /100 | #333 | Tragic 7.9% |
| Yuman | 0.0 /100 | #334 | Tragic 7.9% |
| Chickasaw | 0.0 /100 | #335 | Tragic 8.0% |
| Seminole | 0.0 /100 | #336 | Tragic 8.0% |
| Dutch West Indians | 0.0 /100 | #337 | Tragic 8.2% |
| Colville | 0.0 /100 | #338 | Tragic 8.2% |
| Pima | 0.0 /100 | #339 | Tragic 8.2% |
| Choctaw | 0.0 /100 | #340 | Tragic 8.3% |
| Creek | 0.0 /100 | #341 | Tragic 8.5% |
| Kiowa | 0.0 /100 | #342 | Tragic 8.6% |
| Tohono O'odham | 0.0 /100 | #343 | Tragic 8.7% |
| Tsimshian | 0.0 /100 | #344 | Tragic 8.8% |
| Puerto Ricans | 0.0 /100 | #345 | Tragic 8.9% |
| Houma | 0.0 /100 | #346 | Tragic 9.3% |
Demographics Similar to South American Indians by Ambulatory Disability
In terms of ambulatory disability, the demographic groups most similar to South American Indians are Immigrants from Africa (5.9%, a difference of 0.010%), Immigrants from Poland (5.9%, a difference of 0.21%), Immigrants from Uruguay (5.9%, a difference of 0.26%), Immigrants from South Eastern Asia (5.9%, a difference of 0.29%), and Russian (5.9%, a difference of 0.33%).
| Demographics | Rating | Rank | Ambulatory Disability |
| Colombians | 97.2 /100 | #108 | Exceptional 5.8% |
| Immigrants | Netherlands | 97.1 /100 | #109 | Exceptional 5.8% |
| Immigrants | Colombia | 96.7 /100 | #110 | Exceptional 5.8% |
| Danes | 96.6 /100 | #111 | Exceptional 5.8% |
| South Africans | 96.3 /100 | #112 | Exceptional 5.9% |
| Immigrants | Uruguay | 95.6 /100 | #113 | Exceptional 5.9% |
| Immigrants | Poland | 95.4 /100 | #114 | Exceptional 5.9% |
| South American Indians | 94.8 /100 | #115 | Exceptional 5.9% |
| Immigrants | Africa | 94.7 /100 | #116 | Exceptional 5.9% |
| Immigrants | South Eastern Asia | 93.6 /100 | #117 | Exceptional 5.9% |
| Russians | 93.4 /100 | #118 | Exceptional 5.9% |
| Norwegians | 93.1 /100 | #119 | Exceptional 5.9% |
| Estonians | 92.9 /100 | #120 | Exceptional 5.9% |
| Costa Ricans | 92.6 /100 | #121 | Exceptional 5.9% |
| Icelanders | 92.6 /100 | #122 | Exceptional 5.9% |