Mexican vs Belgian Ambulatory Disability
COMPARE
Mexican
Belgian
Ambulatory Disability
Ambulatory Disability Comparison
Mexicans
Belgians
6.4%
AMBULATORY DISABILITY
3.5/ 100
METRIC RATING
230th/ 347
METRIC RANK
6.2%
AMBULATORY DISABILITY
28.6/ 100
METRIC RATING
195th/ 347
METRIC RANK
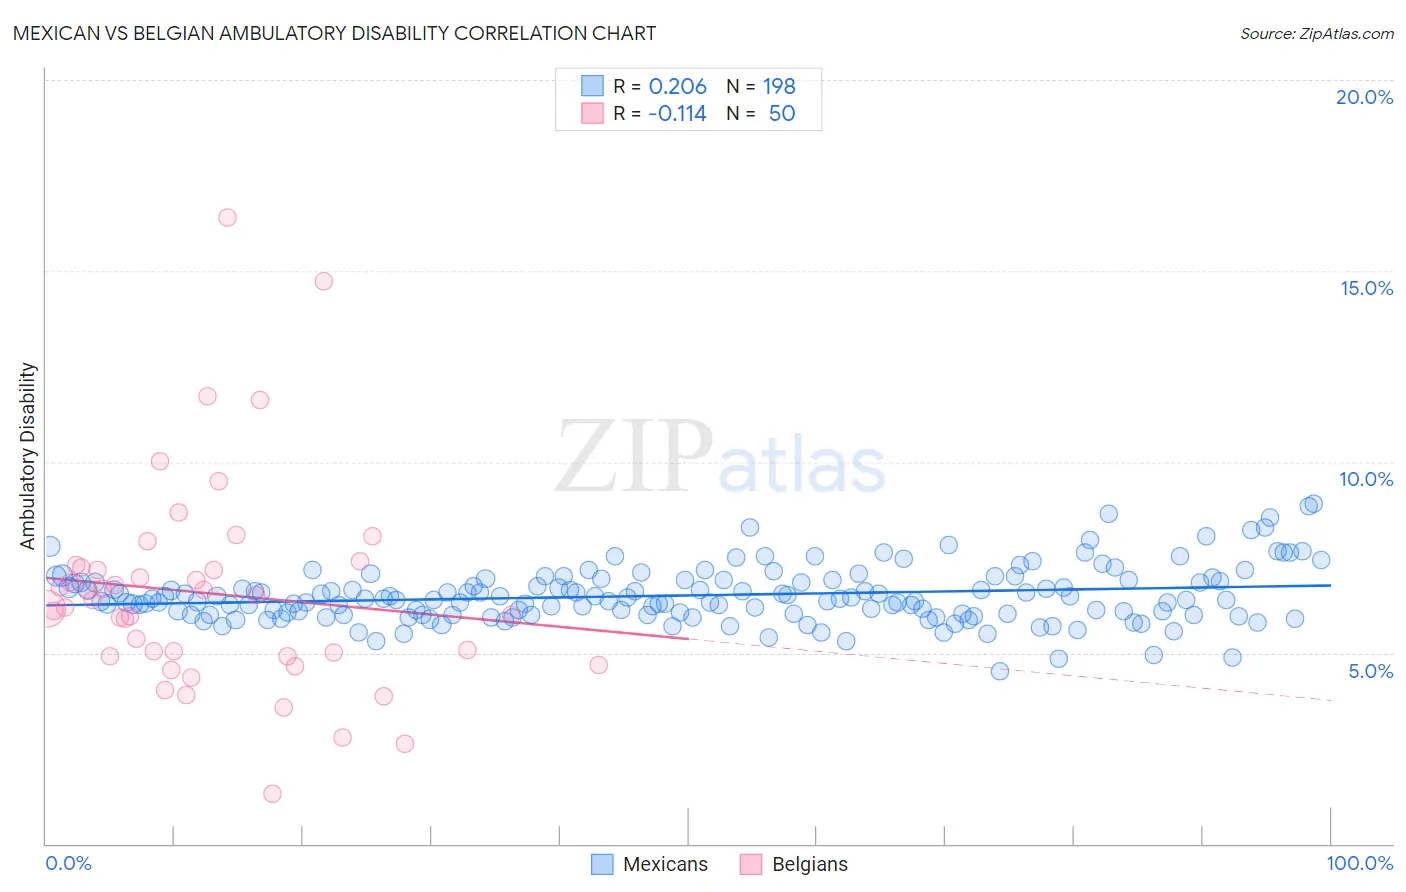
Mexican vs Belgian Ambulatory Disability Correlation Chart
The statistical analysis conducted on geographies consisting of 564,662,817 people shows a weak positive correlation between the proportion of Mexicans and percentage of population with ambulatory disability in the United States with a correlation coefficient (R) of 0.206 and weighted average of 6.4%. Similarly, the statistical analysis conducted on geographies consisting of 355,928,519 people shows a poor negative correlation between the proportion of Belgians and percentage of population with ambulatory disability in the United States with a correlation coefficient (R) of -0.114 and weighted average of 6.2%, a difference of 3.1%.
Ambulatory Disability Correlation Summary
| Measurement | Mexican | Belgian |
| Minimum | 4.5% | 1.3% |
| Maximum | 8.9% | 16.4% |
| Range | 4.4% | 15.1% |
| Mean | 6.5% | 6.6% |
| Median | 6.4% | 6.3% |
| Interquartile 25% (IQ1) | 6.0% | 4.9% |
| Interquartile 75% (IQ3) | 6.9% | 7.2% |
| Interquartile Range (IQR) | 0.88% | 2.3% |
| Standard Deviation (Sample) | 0.72% | 2.8% |
| Standard Deviation (Population) | 0.72% | 2.7% |
Similar Demographics by Ambulatory Disability
Demographics Similar to Mexicans by Ambulatory Disability
In terms of ambulatory disability, the demographic groups most similar to Mexicans are Czechoslovakian (6.4%, a difference of 0.11%), Portuguese (6.4%, a difference of 0.15%), Panamanian (6.4%, a difference of 0.16%), Cuban (6.4%, a difference of 0.17%), and Slavic (6.4%, a difference of 0.49%).
| Demographics | Rating | Rank | Ambulatory Disability |
| Immigrants | Honduras | 7.6 /100 | #223 | Tragic 6.3% |
| Liberians | 7.1 /100 | #224 | Tragic 6.3% |
| Hondurans | 6.3 /100 | #225 | Tragic 6.3% |
| Slavs | 5.1 /100 | #226 | Tragic 6.4% |
| Cubans | 4.0 /100 | #227 | Tragic 6.4% |
| Portuguese | 4.0 /100 | #228 | Tragic 6.4% |
| Czechoslovakians | 3.8 /100 | #229 | Tragic 6.4% |
| Mexicans | 3.5 /100 | #230 | Tragic 6.4% |
| Panamanians | 3.1 /100 | #231 | Tragic 6.4% |
| Assyrians/Chaldeans/Syriacs | 2.4 /100 | #232 | Tragic 6.4% |
| Sub-Saharan Africans | 2.3 /100 | #233 | Tragic 6.4% |
| Immigrants | Liberia | 2.3 /100 | #234 | Tragic 6.4% |
| Hispanics or Latinos | 2.2 /100 | #235 | Tragic 6.4% |
| Dutch | 2.0 /100 | #236 | Tragic 6.4% |
| Immigrants | Germany | 1.8 /100 | #237 | Tragic 6.4% |
Demographics Similar to Belgians by Ambulatory Disability
In terms of ambulatory disability, the demographic groups most similar to Belgians are Malaysian (6.2%, a difference of 0.030%), Guatemalan (6.2%, a difference of 0.080%), Alaska Native (6.2%, a difference of 0.080%), Polish (6.2%, a difference of 0.15%), and Immigrants from Western Europe (6.2%, a difference of 0.19%).
| Demographics | Rating | Rank | Ambulatory Disability |
| British | 34.3 /100 | #188 | Fair 6.2% |
| Ukrainians | 34.0 /100 | #189 | Fair 6.2% |
| Immigrants | Western Africa | 33.4 /100 | #190 | Fair 6.2% |
| Immigrants | Guatemala | 31.9 /100 | #191 | Fair 6.2% |
| Immigrants | Western Europe | 31.6 /100 | #192 | Fair 6.2% |
| Guatemalans | 30.0 /100 | #193 | Fair 6.2% |
| Alaska Natives | 29.8 /100 | #194 | Fair 6.2% |
| Belgians | 28.6 /100 | #195 | Fair 6.2% |
| Malaysians | 28.2 /100 | #196 | Fair 6.2% |
| Poles | 26.3 /100 | #197 | Fair 6.2% |
| Immigrants | Bangladesh | 24.6 /100 | #198 | Fair 6.2% |
| Italians | 22.6 /100 | #199 | Fair 6.2% |
| Immigrants | Cambodia | 21.5 /100 | #200 | Fair 6.2% |
| Immigrants | Central America | 20.1 /100 | #201 | Fair 6.2% |
| Albanians | 19.7 /100 | #202 | Poor 6.2% |