Immigrants from Nigeria vs Belgian Ambulatory Disability
COMPARE
Immigrants from Nigeria
Belgian
Ambulatory Disability
Ambulatory Disability Comparison
Immigrants from Nigeria
Belgians
5.9%
AMBULATORY DISABILITY
90.9/ 100
METRIC RATING
127th/ 347
METRIC RANK
6.2%
AMBULATORY DISABILITY
28.6/ 100
METRIC RATING
195th/ 347
METRIC RANK
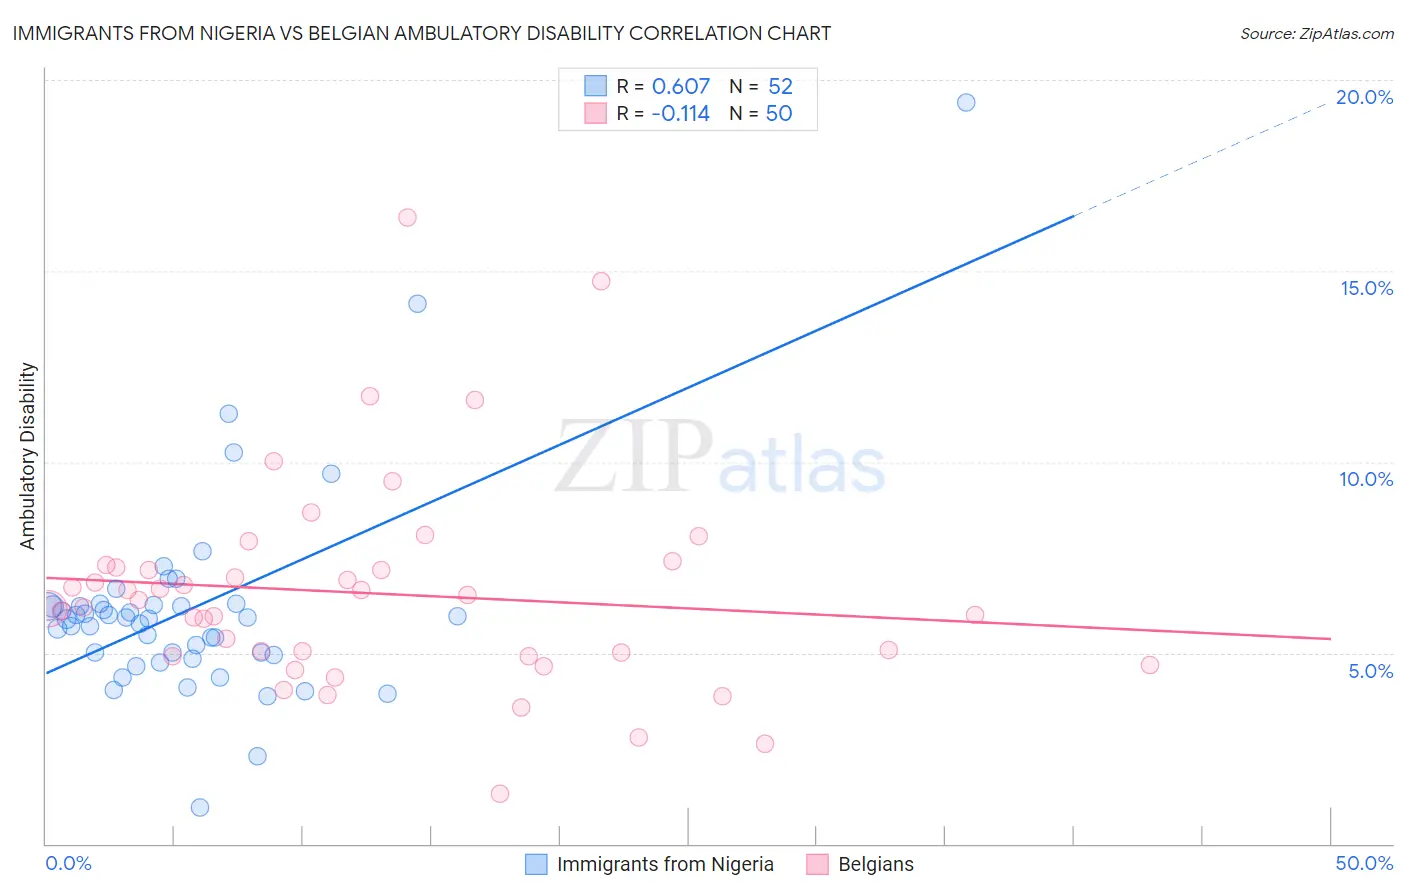
Immigrants from Nigeria vs Belgian Ambulatory Disability Correlation Chart
The statistical analysis conducted on geographies consisting of 283,430,784 people shows a significant positive correlation between the proportion of Immigrants from Nigeria and percentage of population with ambulatory disability in the United States with a correlation coefficient (R) of 0.607 and weighted average of 5.9%. Similarly, the statistical analysis conducted on geographies consisting of 355,928,519 people shows a poor negative correlation between the proportion of Belgians and percentage of population with ambulatory disability in the United States with a correlation coefficient (R) of -0.114 and weighted average of 6.2%, a difference of 4.4%.
Ambulatory Disability Correlation Summary
| Measurement | Immigrants from Nigeria | Belgian |
| Minimum | 0.93% | 1.3% |
| Maximum | 19.4% | 16.4% |
| Range | 18.5% | 15.1% |
| Mean | 6.2% | 6.6% |
| Median | 5.9% | 6.3% |
| Interquartile 25% (IQ1) | 5.0% | 4.9% |
| Interquartile 75% (IQ3) | 6.2% | 7.2% |
| Interquartile Range (IQR) | 1.3% | 2.3% |
| Standard Deviation (Sample) | 2.8% | 2.8% |
| Standard Deviation (Population) | 2.7% | 2.7% |
Similar Demographics by Ambulatory Disability
Demographics Similar to Immigrants from Nigeria by Ambulatory Disability
In terms of ambulatory disability, the demographic groups most similar to Immigrants from Nigeria are Immigrants from Western Asia (5.9%, a difference of 0.040%), Immigrants from Norway (5.9%, a difference of 0.070%), Arab (5.9%, a difference of 0.10%), Korean (5.9%, a difference of 0.11%), and Immigrants from Kazakhstan (5.9%, a difference of 0.18%).
| Demographics | Rating | Rank | Ambulatory Disability |
| Estonians | 92.9 /100 | #120 | Exceptional 5.9% |
| Costa Ricans | 92.6 /100 | #121 | Exceptional 5.9% |
| Icelanders | 92.6 /100 | #122 | Exceptional 5.9% |
| Immigrants | Russia | 92.4 /100 | #123 | Exceptional 5.9% |
| Immigrants | Middle Africa | 92.2 /100 | #124 | Exceptional 5.9% |
| Koreans | 91.6 /100 | #125 | Exceptional 5.9% |
| Arabs | 91.5 /100 | #126 | Exceptional 5.9% |
| Immigrants | Nigeria | 90.9 /100 | #127 | Exceptional 5.9% |
| Immigrants | Western Asia | 90.7 /100 | #128 | Exceptional 5.9% |
| Immigrants | Norway | 90.5 /100 | #129 | Exceptional 5.9% |
| Immigrants | Kazakhstan | 89.7 /100 | #130 | Excellent 5.9% |
| Immigrants | Costa Rica | 89.5 /100 | #131 | Excellent 5.9% |
| Immigrants | Europe | 87.8 /100 | #132 | Excellent 6.0% |
| Immigrants | Immigrants | 86.9 /100 | #133 | Excellent 6.0% |
| Ute | 86.6 /100 | #134 | Excellent 6.0% |
Demographics Similar to Belgians by Ambulatory Disability
In terms of ambulatory disability, the demographic groups most similar to Belgians are Malaysian (6.2%, a difference of 0.030%), Guatemalan (6.2%, a difference of 0.080%), Alaska Native (6.2%, a difference of 0.080%), Polish (6.2%, a difference of 0.15%), and Immigrants from Western Europe (6.2%, a difference of 0.19%).
| Demographics | Rating | Rank | Ambulatory Disability |
| British | 34.3 /100 | #188 | Fair 6.2% |
| Ukrainians | 34.0 /100 | #189 | Fair 6.2% |
| Immigrants | Western Africa | 33.4 /100 | #190 | Fair 6.2% |
| Immigrants | Guatemala | 31.9 /100 | #191 | Fair 6.2% |
| Immigrants | Western Europe | 31.6 /100 | #192 | Fair 6.2% |
| Guatemalans | 30.0 /100 | #193 | Fair 6.2% |
| Alaska Natives | 29.8 /100 | #194 | Fair 6.2% |
| Belgians | 28.6 /100 | #195 | Fair 6.2% |
| Malaysians | 28.2 /100 | #196 | Fair 6.2% |
| Poles | 26.3 /100 | #197 | Fair 6.2% |
| Immigrants | Bangladesh | 24.6 /100 | #198 | Fair 6.2% |
| Italians | 22.6 /100 | #199 | Fair 6.2% |
| Immigrants | Cambodia | 21.5 /100 | #200 | Fair 6.2% |
| Immigrants | Central America | 20.1 /100 | #201 | Fair 6.2% |
| Albanians | 19.7 /100 | #202 | Poor 6.2% |