Tongan vs Belgian Ambulatory Disability
COMPARE
Tongan
Belgian
Ambulatory Disability
Ambulatory Disability Comparison
Tongans
Belgians
5.4%
AMBULATORY DISABILITY
100.0/ 100
METRIC RATING
23rd/ 347
METRIC RANK
6.2%
AMBULATORY DISABILITY
28.6/ 100
METRIC RATING
195th/ 347
METRIC RANK
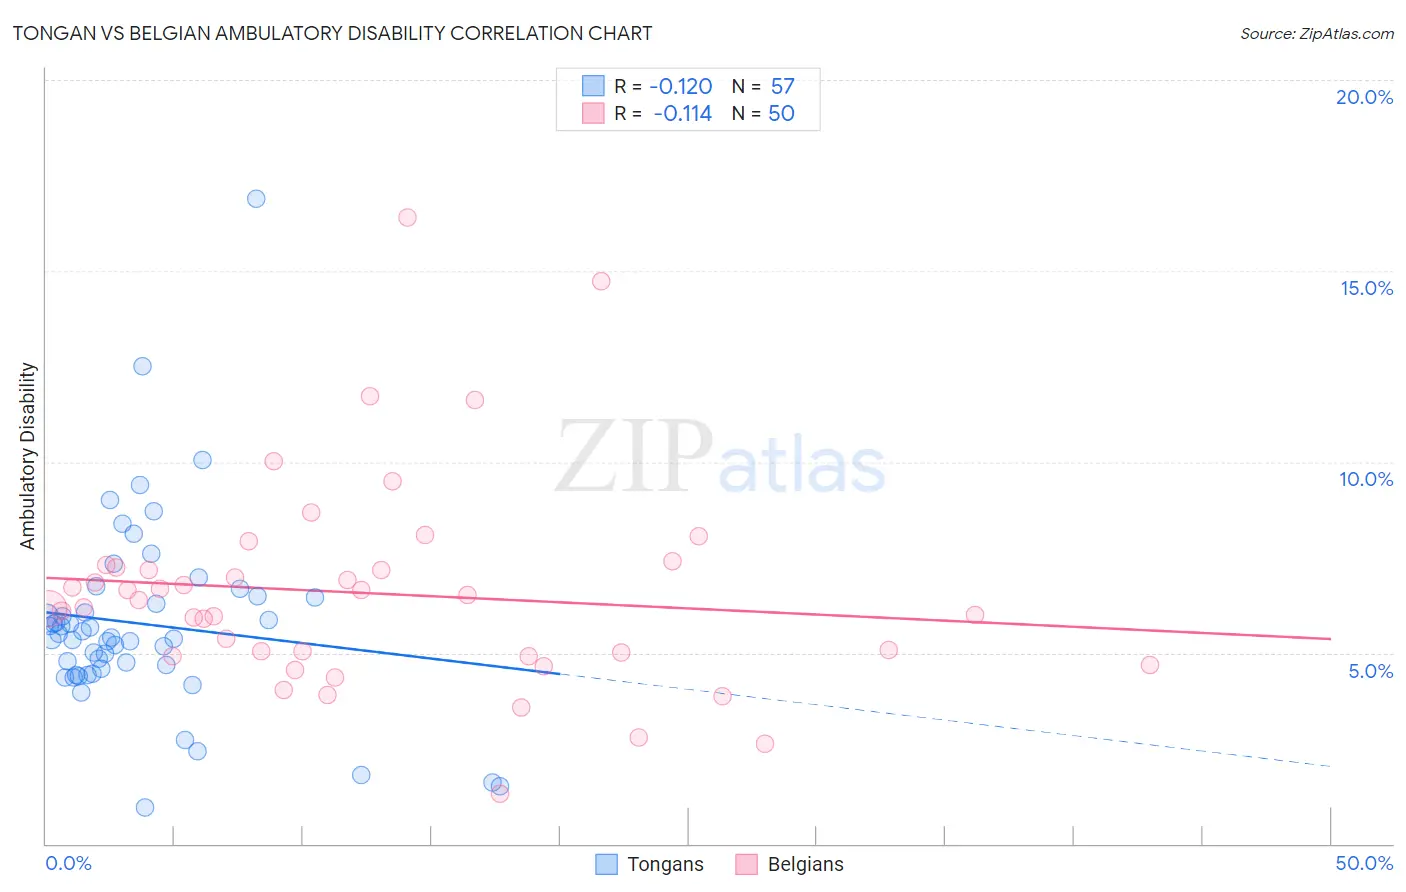
Tongan vs Belgian Ambulatory Disability Correlation Chart
The statistical analysis conducted on geographies consisting of 102,876,651 people shows a poor negative correlation between the proportion of Tongans and percentage of population with ambulatory disability in the United States with a correlation coefficient (R) of -0.120 and weighted average of 5.4%. Similarly, the statistical analysis conducted on geographies consisting of 355,928,519 people shows a poor negative correlation between the proportion of Belgians and percentage of population with ambulatory disability in the United States with a correlation coefficient (R) of -0.114 and weighted average of 6.2%, a difference of 15.0%.
Ambulatory Disability Correlation Summary
| Measurement | Tongan | Belgian |
| Minimum | 0.94% | 1.3% |
| Maximum | 16.9% | 16.4% |
| Range | 16.0% | 15.1% |
| Mean | 5.8% | 6.6% |
| Median | 5.4% | 6.3% |
| Interquartile 25% (IQ1) | 4.5% | 4.9% |
| Interquartile 75% (IQ3) | 6.5% | 7.2% |
| Interquartile Range (IQR) | 1.9% | 2.3% |
| Standard Deviation (Sample) | 2.5% | 2.8% |
| Standard Deviation (Population) | 2.5% | 2.7% |
Similar Demographics by Ambulatory Disability
Demographics Similar to Tongans by Ambulatory Disability
In terms of ambulatory disability, the demographic groups most similar to Tongans are Immigrants from Israel (5.4%, a difference of 0.040%), Immigrants from Saudi Arabia (5.4%, a difference of 0.090%), Zimbabwean (5.4%, a difference of 0.17%), Immigrants from Nepal (5.4%, a difference of 0.20%), and Asian (5.4%, a difference of 0.36%).
| Demographics | Rating | Rank | Ambulatory Disability |
| Immigrants | Hong Kong | 100.0 /100 | #16 | Exceptional 5.3% |
| Immigrants | Ethiopia | 100.0 /100 | #17 | Exceptional 5.4% |
| Immigrants | Sri Lanka | 100.0 /100 | #18 | Exceptional 5.4% |
| Indians (Asian) | 100.0 /100 | #19 | Exceptional 5.4% |
| Ethiopians | 100.0 /100 | #20 | Exceptional 5.4% |
| Immigrants | Kuwait | 100.0 /100 | #21 | Exceptional 5.4% |
| Immigrants | Israel | 100.0 /100 | #22 | Exceptional 5.4% |
| Tongans | 100.0 /100 | #23 | Exceptional 5.4% |
| Immigrants | Saudi Arabia | 100.0 /100 | #24 | Exceptional 5.4% |
| Zimbabweans | 100.0 /100 | #25 | Exceptional 5.4% |
| Immigrants | Nepal | 100.0 /100 | #26 | Exceptional 5.4% |
| Asians | 100.0 /100 | #27 | Exceptional 5.4% |
| Cambodians | 100.0 /100 | #28 | Exceptional 5.4% |
| Immigrants | Iran | 100.0 /100 | #29 | Exceptional 5.4% |
| Immigrants | Turkey | 100.0 /100 | #30 | Exceptional 5.4% |
Demographics Similar to Belgians by Ambulatory Disability
In terms of ambulatory disability, the demographic groups most similar to Belgians are Malaysian (6.2%, a difference of 0.030%), Guatemalan (6.2%, a difference of 0.080%), Alaska Native (6.2%, a difference of 0.080%), Polish (6.2%, a difference of 0.15%), and Immigrants from Western Europe (6.2%, a difference of 0.19%).
| Demographics | Rating | Rank | Ambulatory Disability |
| British | 34.3 /100 | #188 | Fair 6.2% |
| Ukrainians | 34.0 /100 | #189 | Fair 6.2% |
| Immigrants | Western Africa | 33.4 /100 | #190 | Fair 6.2% |
| Immigrants | Guatemala | 31.9 /100 | #191 | Fair 6.2% |
| Immigrants | Western Europe | 31.6 /100 | #192 | Fair 6.2% |
| Guatemalans | 30.0 /100 | #193 | Fair 6.2% |
| Alaska Natives | 29.8 /100 | #194 | Fair 6.2% |
| Belgians | 28.6 /100 | #195 | Fair 6.2% |
| Malaysians | 28.2 /100 | #196 | Fair 6.2% |
| Poles | 26.3 /100 | #197 | Fair 6.2% |
| Immigrants | Bangladesh | 24.6 /100 | #198 | Fair 6.2% |
| Italians | 22.6 /100 | #199 | Fair 6.2% |
| Immigrants | Cambodia | 21.5 /100 | #200 | Fair 6.2% |
| Immigrants | Central America | 20.1 /100 | #201 | Fair 6.2% |
| Albanians | 19.7 /100 | #202 | Poor 6.2% |