Pima vs Belgian Disability
COMPARE
Pima
Belgian
Disability
Disability Comparison
Pima
Belgians
13.7%
DISABILITY
0.0/ 100
METRIC RATING
316th/ 347
METRIC RANK
12.3%
DISABILITY
0.8/ 100
METRIC RATING
253rd/ 347
METRIC RANK
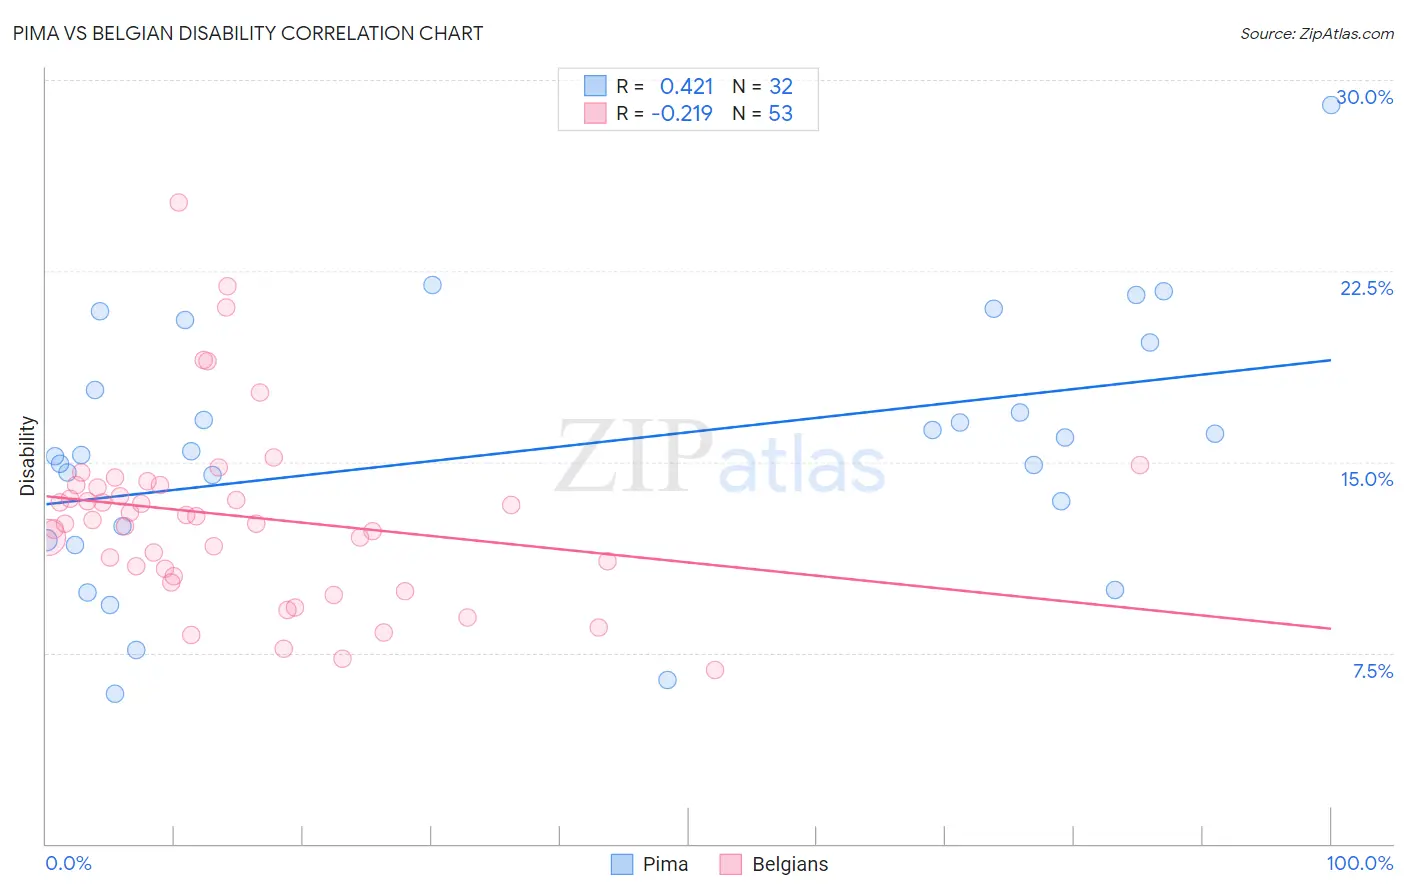
Pima vs Belgian Disability Correlation Chart
The statistical analysis conducted on geographies consisting of 61,542,416 people shows a moderate positive correlation between the proportion of Pima and percentage of population with a disability in the United States with a correlation coefficient (R) of 0.421 and weighted average of 13.7%. Similarly, the statistical analysis conducted on geographies consisting of 355,995,745 people shows a weak negative correlation between the proportion of Belgians and percentage of population with a disability in the United States with a correlation coefficient (R) of -0.219 and weighted average of 12.3%, a difference of 11.3%.
Disability Correlation Summary
| Measurement | Pima | Belgian |
| Minimum | 5.9% | 6.8% |
| Maximum | 29.0% | 25.2% |
| Range | 23.1% | 18.3% |
| Mean | 15.5% | 12.9% |
| Median | 15.3% | 12.7% |
| Interquartile 25% (IQ1) | 12.2% | 10.7% |
| Interquartile 75% (IQ3) | 18.7% | 14.1% |
| Interquartile Range (IQR) | 6.5% | 3.4% |
| Standard Deviation (Sample) | 5.1% | 3.6% |
| Standard Deviation (Population) | 5.0% | 3.6% |
Similar Demographics by Disability
Demographics Similar to Pima by Disability
In terms of disability, the demographic groups most similar to Pima are Immigrants from Cabo Verde (13.7%, a difference of 0.0%), Black/African American (13.7%, a difference of 0.030%), Puget Sound Salish (13.7%, a difference of 0.030%), Cree (13.7%, a difference of 0.070%), and Spanish American (13.6%, a difference of 0.42%).
| Demographics | Rating | Rank | Disability |
| Tlingit-Haida | 0.0 /100 | #309 | Tragic 13.5% |
| Blackfeet | 0.0 /100 | #310 | Tragic 13.6% |
| Delaware | 0.0 /100 | #311 | Tragic 13.6% |
| Spanish Americans | 0.0 /100 | #312 | Tragic 13.6% |
| Cree | 0.0 /100 | #313 | Tragic 13.7% |
| Blacks/African Americans | 0.0 /100 | #314 | Tragic 13.7% |
| Puget Sound Salish | 0.0 /100 | #315 | Tragic 13.7% |
| Pima | 0.0 /100 | #316 | Tragic 13.7% |
| Immigrants | Cabo Verde | 0.0 /100 | #317 | Tragic 13.7% |
| Menominee | 0.0 /100 | #318 | Tragic 13.8% |
| Iroquois | 0.0 /100 | #319 | Tragic 13.8% |
| Apache | 0.0 /100 | #320 | Tragic 13.9% |
| Paiute | 0.0 /100 | #321 | Tragic 13.9% |
| Americans | 0.0 /100 | #322 | Tragic 13.9% |
| Comanche | 0.0 /100 | #323 | Tragic 14.1% |
Demographics Similar to Belgians by Disability
In terms of disability, the demographic groups most similar to Belgians are German Russian (12.3%, a difference of 0.030%), Bermudan (12.3%, a difference of 0.31%), Slovene (12.4%, a difference of 0.35%), Immigrants from Dominica (12.4%, a difference of 0.42%), and Subsaharan African (12.3%, a difference of 0.50%).
| Demographics | Rating | Rank | Disability |
| Swiss | 1.5 /100 | #246 | Tragic 12.2% |
| Indonesians | 1.4 /100 | #247 | Tragic 12.2% |
| Guamanians/Chamorros | 1.4 /100 | #248 | Tragic 12.3% |
| Carpatho Rusyns | 1.4 /100 | #249 | Tragic 12.3% |
| Sub-Saharan Africans | 1.4 /100 | #250 | Tragic 12.3% |
| Europeans | 1.4 /100 | #251 | Tragic 12.3% |
| Bermudans | 1.1 /100 | #252 | Tragic 12.3% |
| Belgians | 0.8 /100 | #253 | Tragic 12.3% |
| German Russians | 0.8 /100 | #254 | Tragic 12.3% |
| Slovenes | 0.6 /100 | #255 | Tragic 12.4% |
| Immigrants | Dominica | 0.6 /100 | #256 | Tragic 12.4% |
| Immigrants | Laos | 0.5 /100 | #257 | Tragic 12.4% |
| Slavs | 0.5 /100 | #258 | Tragic 12.4% |
| Canadians | 0.4 /100 | #259 | Tragic 12.4% |
| Immigrants | Liberia | 0.4 /100 | #260 | Tragic 12.4% |