Peruvian vs Immigrants from England Male Disability
COMPARE
Peruvian
Immigrants from England
Male Disability
Male Disability Comparison
Peruvians
Immigrants from England
10.4%
MALE DISABILITY
99.6/ 100
METRIC RATING
54th/ 347
METRIC RANK
11.7%
MALE DISABILITY
4.0/ 100
METRIC RATING
218th/ 347
METRIC RANK
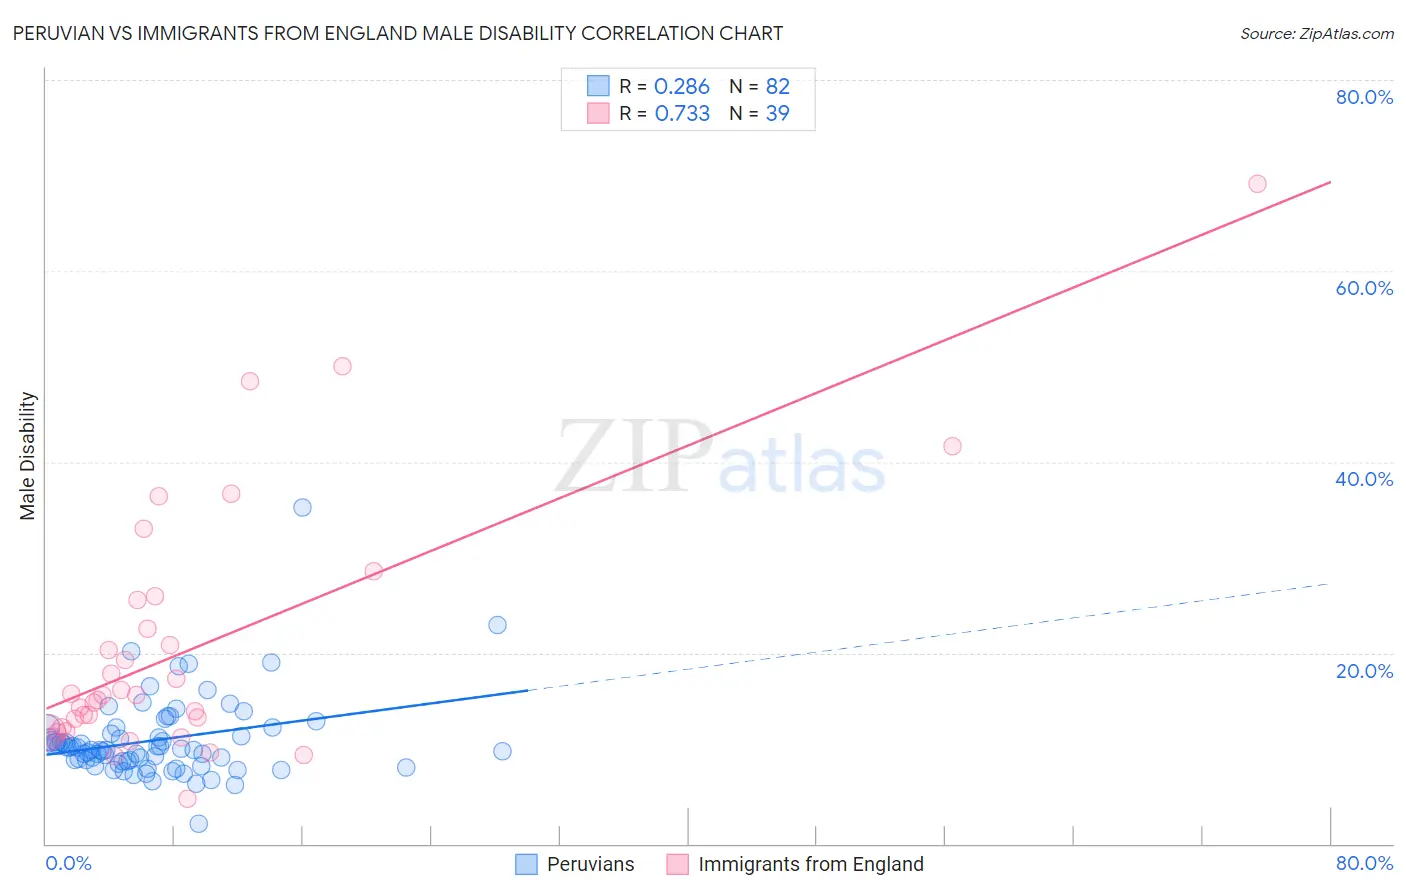
Peruvian vs Immigrants from England Male Disability Correlation Chart
The statistical analysis conducted on geographies consisting of 363,183,994 people shows a weak positive correlation between the proportion of Peruvians and percentage of males with a disability in the United States with a correlation coefficient (R) of 0.286 and weighted average of 10.4%. Similarly, the statistical analysis conducted on geographies consisting of 391,879,882 people shows a strong positive correlation between the proportion of Immigrants from England and percentage of males with a disability in the United States with a correlation coefficient (R) of 0.733 and weighted average of 11.7%, a difference of 13.0%.
Male Disability Correlation Summary
| Measurement | Peruvian | Immigrants from England |
| Minimum | 2.1% | 4.7% |
| Maximum | 35.3% | 69.2% |
| Range | 33.1% | 64.4% |
| Mean | 10.9% | 20.5% |
| Median | 9.9% | 15.5% |
| Interquartile 25% (IQ1) | 8.7% | 11.8% |
| Interquartile 75% (IQ3) | 11.5% | 25.5% |
| Interquartile Range (IQR) | 2.9% | 13.6% |
| Standard Deviation (Sample) | 4.3% | 13.5% |
| Standard Deviation (Population) | 4.3% | 13.3% |
Similar Demographics by Male Disability
Demographics Similar to Peruvians by Male Disability
In terms of male disability, the demographic groups most similar to Peruvians are Immigrants from Eritrea (10.4%, a difference of 0.020%), Immigrants from Uzbekistan (10.4%, a difference of 0.040%), Immigrants from Saudi Arabia (10.4%, a difference of 0.060%), Tongan (10.4%, a difference of 0.060%), and Salvadoran (10.4%, a difference of 0.080%).
| Demographics | Rating | Rank | Male Disability |
| Immigrants | Peru | 99.7 /100 | #47 | Exceptional 10.3% |
| Israelis | 99.7 /100 | #48 | Exceptional 10.3% |
| Immigrants | Spain | 99.7 /100 | #49 | Exceptional 10.3% |
| South Americans | 99.6 /100 | #50 | Exceptional 10.3% |
| Salvadorans | 99.6 /100 | #51 | Exceptional 10.4% |
| Immigrants | Saudi Arabia | 99.6 /100 | #52 | Exceptional 10.4% |
| Immigrants | Uzbekistan | 99.6 /100 | #53 | Exceptional 10.4% |
| Peruvians | 99.6 /100 | #54 | Exceptional 10.4% |
| Immigrants | Eritrea | 99.6 /100 | #55 | Exceptional 10.4% |
| Tongans | 99.6 /100 | #56 | Exceptional 10.4% |
| Immigrants | South America | 99.6 /100 | #57 | Exceptional 10.4% |
| Immigrants | Japan | 99.5 /100 | #58 | Exceptional 10.4% |
| Immigrants | Australia | 99.5 /100 | #59 | Exceptional 10.4% |
| Immigrants | Colombia | 99.5 /100 | #60 | Exceptional 10.4% |
| Immigrants | Northern Africa | 99.4 /100 | #61 | Exceptional 10.4% |
Demographics Similar to Immigrants from England by Male Disability
In terms of male disability, the demographic groups most similar to Immigrants from England are Panamanian (11.7%, a difference of 0.060%), Immigrants from Western Europe (11.7%, a difference of 0.070%), Immigrants from Congo (11.7%, a difference of 0.080%), Immigrants from Dominica (11.7%, a difference of 0.21%), and Alsatian (11.7%, a difference of 0.23%).
| Demographics | Rating | Rank | Male Disability |
| Immigrants | Thailand | 8.4 /100 | #211 | Tragic 11.6% |
| Immigrants | Scotland | 8.2 /100 | #212 | Tragic 11.6% |
| Mexican American Indians | 7.8 /100 | #213 | Tragic 11.6% |
| Lithuanians | 6.6 /100 | #214 | Tragic 11.6% |
| Indonesians | 5.9 /100 | #215 | Tragic 11.6% |
| Immigrants | Dominican Republic | 4.9 /100 | #216 | Tragic 11.7% |
| Immigrants | Dominica | 4.6 /100 | #217 | Tragic 11.7% |
| Immigrants | England | 4.0 /100 | #218 | Tragic 11.7% |
| Panamanians | 3.8 /100 | #219 | Tragic 11.7% |
| Immigrants | Western Europe | 3.8 /100 | #220 | Tragic 11.7% |
| Immigrants | Congo | 3.7 /100 | #221 | Tragic 11.7% |
| Alsatians | 3.3 /100 | #222 | Tragic 11.7% |
| Immigrants | Bahamas | 3.2 /100 | #223 | Tragic 11.7% |
| Japanese | 3.1 /100 | #224 | Tragic 11.7% |
| Liberians | 3.1 /100 | #225 | Tragic 11.8% |