Peruvian vs Immigrants from Micronesia Associate's Degree
COMPARE
Peruvian
Immigrants from Micronesia
Associate's Degree
Associate's Degree Comparison
Peruvians
Immigrants from Micronesia
46.4%
ASSOCIATE'S DEGREE
50.5/ 100
METRIC RATING
172nd/ 347
METRIC RANK
40.2%
ASSOCIATE'S DEGREE
0.1/ 100
METRIC RATING
280th/ 347
METRIC RANK
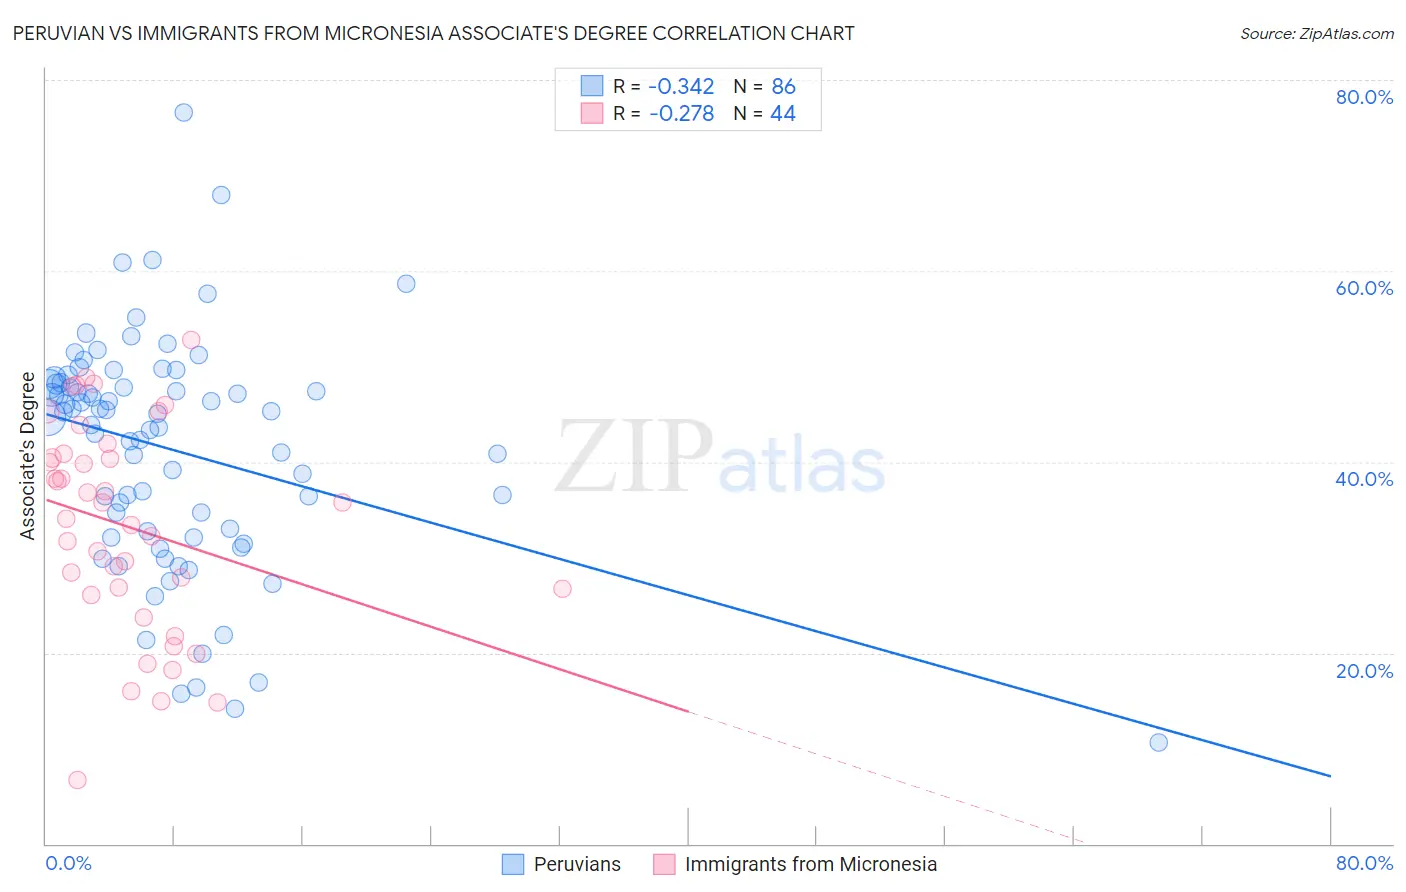
Peruvian vs Immigrants from Micronesia Associate's Degree Correlation Chart
The statistical analysis conducted on geographies consisting of 363,234,961 people shows a mild negative correlation between the proportion of Peruvians and percentage of population with at least associate's degree education in the United States with a correlation coefficient (R) of -0.342 and weighted average of 46.4%. Similarly, the statistical analysis conducted on geographies consisting of 61,609,499 people shows a weak negative correlation between the proportion of Immigrants from Micronesia and percentage of population with at least associate's degree education in the United States with a correlation coefficient (R) of -0.278 and weighted average of 40.2%, a difference of 15.4%.
Associate's Degree Correlation Summary
| Measurement | Peruvian | Immigrants from Micronesia |
| Minimum | 10.6% | 6.6% |
| Maximum | 76.6% | 52.7% |
| Range | 66.0% | 46.1% |
| Mean | 41.3% | 33.2% |
| Median | 44.9% | 34.9% |
| Interquartile 25% (IQ1) | 32.7% | 26.4% |
| Interquartile 75% (IQ3) | 48.1% | 40.6% |
| Interquartile Range (IQR) | 15.5% | 14.2% |
| Standard Deviation (Sample) | 12.1% | 11.0% |
| Standard Deviation (Population) | 12.0% | 10.9% |
Similar Demographics by Associate's Degree
Demographics Similar to Peruvians by Associate's Degree
In terms of associate's degree, the demographic groups most similar to Peruvians are Immigrants from Iraq (46.4%, a difference of 0.020%), English (46.4%, a difference of 0.040%), Belgian (46.3%, a difference of 0.12%), Finnish (46.3%, a difference of 0.15%), and Slovak (46.3%, a difference of 0.16%).
| Demographics | Rating | Rank | Associate's Degree |
| Immigrants | South America | 59.9 /100 | #165 | Average 46.7% |
| Hungarians | 59.3 /100 | #166 | Average 46.7% |
| Immigrants | Sierra Leone | 59.2 /100 | #167 | Average 46.7% |
| Immigrants | Somalia | 55.5 /100 | #168 | Average 46.5% |
| Uruguayans | 55.4 /100 | #169 | Average 46.5% |
| Irish | 53.6 /100 | #170 | Average 46.5% |
| Basques | 52.8 /100 | #171 | Average 46.5% |
| Peruvians | 50.5 /100 | #172 | Average 46.4% |
| Immigrants | Iraq | 50.3 /100 | #173 | Average 46.4% |
| English | 50.0 /100 | #174 | Average 46.4% |
| Belgians | 48.9 /100 | #175 | Average 46.3% |
| Finns | 48.5 /100 | #176 | Average 46.3% |
| Slovaks | 48.4 /100 | #177 | Average 46.3% |
| Immigrants | Bosnia and Herzegovina | 48.3 /100 | #178 | Average 46.3% |
| Sri Lankans | 47.6 /100 | #179 | Average 46.3% |
Demographics Similar to Immigrants from Micronesia by Associate's Degree
In terms of associate's degree, the demographic groups most similar to Immigrants from Micronesia are Immigrants from Portugal (40.1%, a difference of 0.10%), Immigrants from Nicaragua (40.3%, a difference of 0.20%), Ottawa (40.3%, a difference of 0.24%), Blackfeet (40.3%, a difference of 0.39%), and Bangladeshi (40.0%, a difference of 0.41%).
| Demographics | Rating | Rank | Associate's Degree |
| Puget Sound Salish | 0.1 /100 | #273 | Tragic 40.5% |
| Immigrants | Dominica | 0.1 /100 | #274 | Tragic 40.5% |
| Potawatomi | 0.1 /100 | #275 | Tragic 40.4% |
| Puerto Ricans | 0.1 /100 | #276 | Tragic 40.4% |
| Blackfeet | 0.1 /100 | #277 | Tragic 40.3% |
| Ottawa | 0.1 /100 | #278 | Tragic 40.3% |
| Immigrants | Nicaragua | 0.1 /100 | #279 | Tragic 40.3% |
| Immigrants | Micronesia | 0.1 /100 | #280 | Tragic 40.2% |
| Immigrants | Portugal | 0.1 /100 | #281 | Tragic 40.1% |
| Bangladeshis | 0.1 /100 | #282 | Tragic 40.0% |
| Haitians | 0.1 /100 | #283 | Tragic 40.0% |
| Comanche | 0.1 /100 | #284 | Tragic 39.9% |
| Immigrants | Belize | 0.1 /100 | #285 | Tragic 39.9% |
| Immigrants | Caribbean | 0.0 /100 | #286 | Tragic 39.7% |
| Aleuts | 0.0 /100 | #287 | Tragic 39.6% |