Peruvian vs Immigrants from Micronesia 9th Grade
COMPARE
Peruvian
Immigrants from Micronesia
9th Grade
9th Grade Comparison
Peruvians
Immigrants from Micronesia
93.8%
9TH GRADE
0.2/ 100
METRIC RATING
274th/ 347
METRIC RANK
94.7%
9TH GRADE
24.7/ 100
METRIC RATING
197th/ 347
METRIC RANK
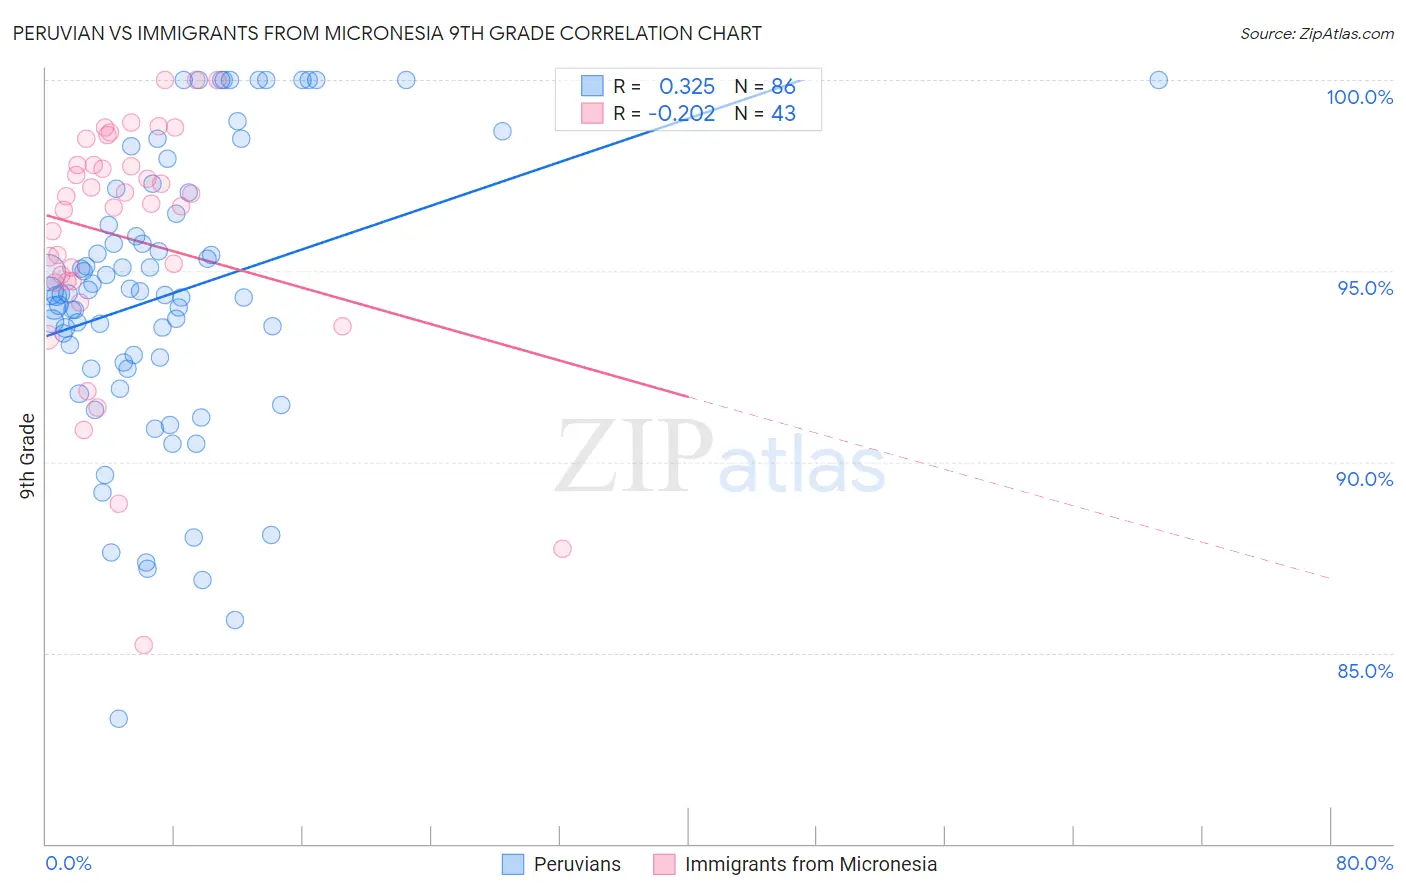
Peruvian vs Immigrants from Micronesia 9th Grade Correlation Chart
The statistical analysis conducted on geographies consisting of 363,251,075 people shows a mild positive correlation between the proportion of Peruvians and percentage of population with at least 9th grade education in the United States with a correlation coefficient (R) of 0.325 and weighted average of 93.8%. Similarly, the statistical analysis conducted on geographies consisting of 61,604,657 people shows a weak negative correlation between the proportion of Immigrants from Micronesia and percentage of population with at least 9th grade education in the United States with a correlation coefficient (R) of -0.202 and weighted average of 94.7%, a difference of 0.97%.
9th Grade Correlation Summary
| Measurement | Peruvian | Immigrants from Micronesia |
| Minimum | 83.3% | 85.2% |
| Maximum | 100.0% | 100.0% |
| Range | 16.7% | 14.8% |
| Mean | 94.4% | 95.9% |
| Median | 94.4% | 96.8% |
| Interquartile 25% (IQ1) | 92.6% | 94.7% |
| Interquartile 75% (IQ3) | 96.5% | 97.8% |
| Interquartile Range (IQR) | 3.9% | 3.0% |
| Standard Deviation (Sample) | 3.7% | 3.3% |
| Standard Deviation (Population) | 3.7% | 3.2% |
Similar Demographics by 9th Grade
Demographics Similar to Peruvians by 9th Grade
In terms of 9th grade, the demographic groups most similar to Peruvians are Immigrants from South America (93.8%, a difference of 0.0%), Immigrants from Western Africa (93.8%, a difference of 0.010%), Immigrants from Colombia (93.8%, a difference of 0.010%), Immigrants from Ghana (93.8%, a difference of 0.020%), and West Indian (93.7%, a difference of 0.030%).
| Demographics | Rating | Rank | 9th Grade |
| Armenians | 0.3 /100 | #267 | Tragic 93.9% |
| Immigrants | Bolivia | 0.3 /100 | #268 | Tragic 93.9% |
| Immigrants | Uruguay | 0.2 /100 | #269 | Tragic 93.8% |
| Yuman | 0.2 /100 | #270 | Tragic 93.8% |
| Immigrants | Ghana | 0.2 /100 | #271 | Tragic 93.8% |
| Immigrants | Western Africa | 0.2 /100 | #272 | Tragic 93.8% |
| Immigrants | South America | 0.2 /100 | #273 | Tragic 93.8% |
| Peruvians | 0.2 /100 | #274 | Tragic 93.8% |
| Immigrants | Colombia | 0.2 /100 | #275 | Tragic 93.8% |
| West Indians | 0.2 /100 | #276 | Tragic 93.7% |
| Immigrants | Philippines | 0.1 /100 | #277 | Tragic 93.7% |
| Immigrants | Eritrea | 0.1 /100 | #278 | Tragic 93.7% |
| Trinidadians and Tobagonians | 0.1 /100 | #279 | Tragic 93.7% |
| Taiwanese | 0.1 /100 | #280 | Tragic 93.6% |
| Immigrants | Trinidad and Tobago | 0.1 /100 | #281 | Tragic 93.6% |
Demographics Similar to Immigrants from Micronesia by 9th Grade
In terms of 9th grade, the demographic groups most similar to Immigrants from Micronesia are Immigrants from Lebanon (94.7%, a difference of 0.020%), Hawaiian (94.7%, a difference of 0.020%), Marshallese (94.7%, a difference of 0.030%), Panamanian (94.7%, a difference of 0.040%), and Laotian (94.6%, a difference of 0.040%).
| Demographics | Rating | Rank | 9th Grade |
| Sudanese | 32.7 /100 | #190 | Fair 94.7% |
| Assyrians/Chaldeans/Syriacs | 32.0 /100 | #191 | Fair 94.7% |
| Immigrants | Northern Africa | 30.7 /100 | #192 | Fair 94.7% |
| Paraguayans | 30.1 /100 | #193 | Fair 94.7% |
| Panamanians | 29.0 /100 | #194 | Fair 94.7% |
| Marshallese | 27.9 /100 | #195 | Fair 94.7% |
| Immigrants | Lebanon | 27.2 /100 | #196 | Fair 94.7% |
| Immigrants | Micronesia | 24.7 /100 | #197 | Fair 94.7% |
| Hawaiians | 22.7 /100 | #198 | Fair 94.7% |
| Laotians | 21.0 /100 | #199 | Fair 94.6% |
| Immigrants | Zaire | 20.6 /100 | #200 | Fair 94.6% |
| Blacks/African Americans | 20.5 /100 | #201 | Fair 94.6% |
| Immigrants | Eastern Asia | 19.8 /100 | #202 | Poor 94.6% |
| Immigrants | Bahamas | 19.8 /100 | #203 | Poor 94.6% |
| Moroccans | 19.6 /100 | #204 | Poor 94.6% |