Peruvian vs Immigrants from Belize Male Disability
COMPARE
Peruvian
Immigrants from Belize
Male Disability
Male Disability Comparison
Peruvians
Immigrants from Belize
10.4%
MALE DISABILITY
99.6/ 100
METRIC RATING
54th/ 347
METRIC RANK
11.3%
MALE DISABILITY
33.7/ 100
METRIC RATING
182nd/ 347
METRIC RANK
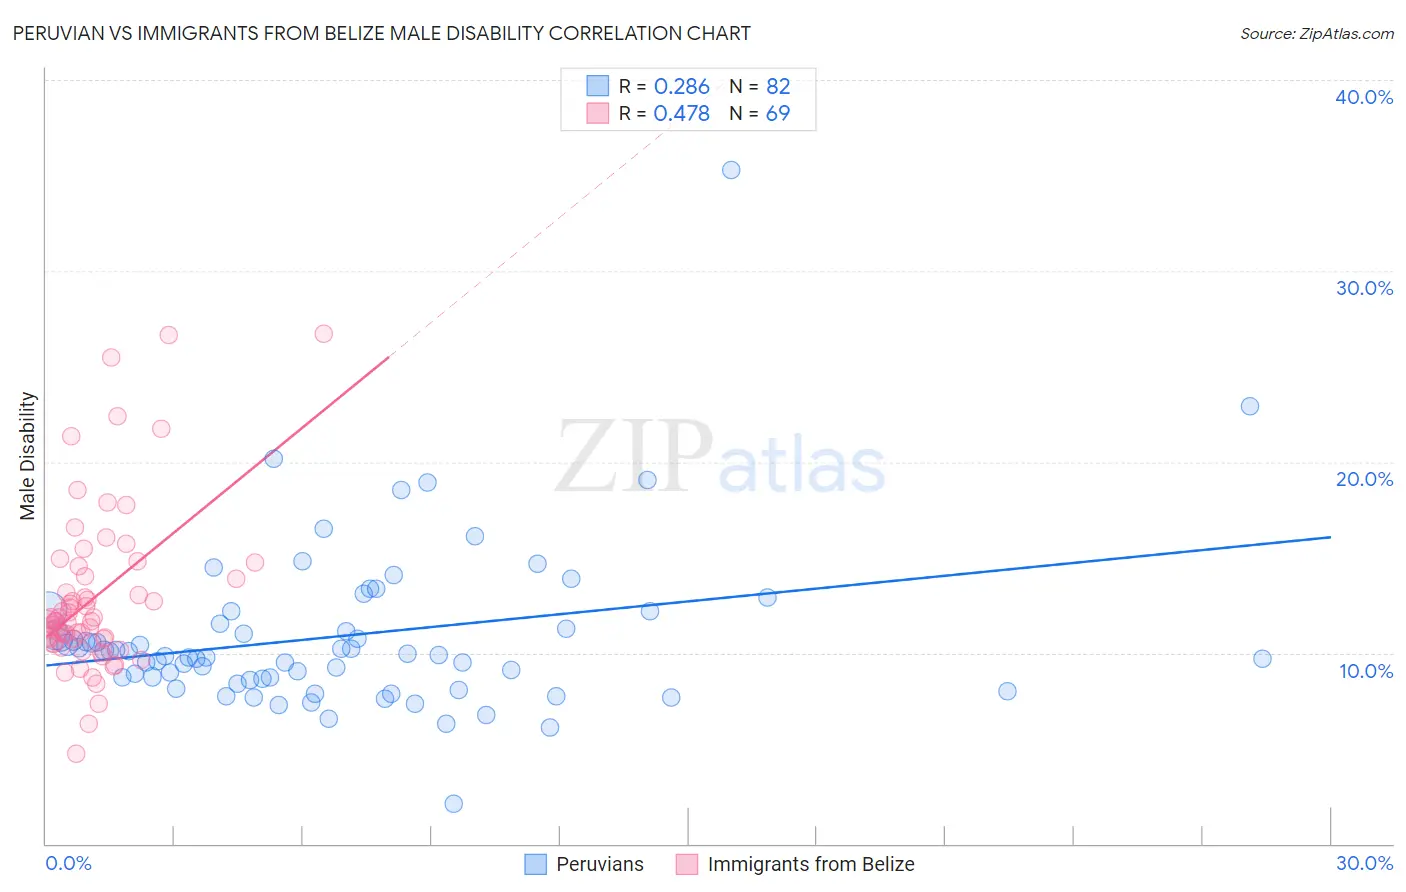
Peruvian vs Immigrants from Belize Male Disability Correlation Chart
The statistical analysis conducted on geographies consisting of 363,183,994 people shows a weak positive correlation between the proportion of Peruvians and percentage of males with a disability in the United States with a correlation coefficient (R) of 0.286 and weighted average of 10.4%. Similarly, the statistical analysis conducted on geographies consisting of 130,304,028 people shows a moderate positive correlation between the proportion of Immigrants from Belize and percentage of males with a disability in the United States with a correlation coefficient (R) of 0.478 and weighted average of 11.3%, a difference of 9.2%.
Male Disability Correlation Summary
| Measurement | Peruvian | Immigrants from Belize |
| Minimum | 2.1% | 4.7% |
| Maximum | 35.3% | 26.7% |
| Range | 33.1% | 22.0% |
| Mean | 10.9% | 12.9% |
| Median | 9.9% | 11.7% |
| Interquartile 25% (IQ1) | 8.7% | 10.6% |
| Interquartile 75% (IQ3) | 11.5% | 14.3% |
| Interquartile Range (IQR) | 2.9% | 3.7% |
| Standard Deviation (Sample) | 4.3% | 4.3% |
| Standard Deviation (Population) | 4.3% | 4.3% |
Similar Demographics by Male Disability
Demographics Similar to Peruvians by Male Disability
In terms of male disability, the demographic groups most similar to Peruvians are Immigrants from Eritrea (10.4%, a difference of 0.020%), Immigrants from Uzbekistan (10.4%, a difference of 0.040%), Immigrants from Saudi Arabia (10.4%, a difference of 0.060%), Tongan (10.4%, a difference of 0.060%), and Salvadoran (10.4%, a difference of 0.080%).
| Demographics | Rating | Rank | Male Disability |
| Immigrants | Peru | 99.7 /100 | #47 | Exceptional 10.3% |
| Israelis | 99.7 /100 | #48 | Exceptional 10.3% |
| Immigrants | Spain | 99.7 /100 | #49 | Exceptional 10.3% |
| South Americans | 99.6 /100 | #50 | Exceptional 10.3% |
| Salvadorans | 99.6 /100 | #51 | Exceptional 10.4% |
| Immigrants | Saudi Arabia | 99.6 /100 | #52 | Exceptional 10.4% |
| Immigrants | Uzbekistan | 99.6 /100 | #53 | Exceptional 10.4% |
| Peruvians | 99.6 /100 | #54 | Exceptional 10.4% |
| Immigrants | Eritrea | 99.6 /100 | #55 | Exceptional 10.4% |
| Tongans | 99.6 /100 | #56 | Exceptional 10.4% |
| Immigrants | South America | 99.6 /100 | #57 | Exceptional 10.4% |
| Immigrants | Japan | 99.5 /100 | #58 | Exceptional 10.4% |
| Immigrants | Australia | 99.5 /100 | #59 | Exceptional 10.4% |
| Immigrants | Colombia | 99.5 /100 | #60 | Exceptional 10.4% |
| Immigrants | Northern Africa | 99.4 /100 | #61 | Exceptional 10.4% |
Demographics Similar to Immigrants from Belize by Male Disability
In terms of male disability, the demographic groups most similar to Immigrants from Belize are Immigrants from Senegal (11.3%, a difference of 0.040%), Immigrants from Central America (11.3%, a difference of 0.050%), Iraqi (11.3%, a difference of 0.20%), Pakistani (11.3%, a difference of 0.21%), and Immigrants from Zaire (11.4%, a difference of 0.39%).
| Demographics | Rating | Rank | Male Disability |
| Immigrants | Honduras | 48.7 /100 | #175 | Average 11.2% |
| Syrians | 46.6 /100 | #176 | Average 11.2% |
| Immigrants | Norway | 44.2 /100 | #177 | Average 11.3% |
| Australians | 42.2 /100 | #178 | Average 11.3% |
| Immigrants | Caribbean | 41.4 /100 | #179 | Average 11.3% |
| Hondurans | 41.1 /100 | #180 | Average 11.3% |
| Immigrants | Senegal | 34.4 /100 | #181 | Fair 11.3% |
| Immigrants | Belize | 33.7 /100 | #182 | Fair 11.3% |
| Immigrants | Central America | 32.9 /100 | #183 | Fair 11.3% |
| Iraqis | 30.5 /100 | #184 | Fair 11.3% |
| Pakistanis | 30.3 /100 | #185 | Fair 11.3% |
| Immigrants | Zaire | 27.6 /100 | #186 | Fair 11.4% |
| Immigrants | Austria | 27.3 /100 | #187 | Fair 11.4% |
| Estonians | 26.8 /100 | #188 | Fair 11.4% |
| Immigrants | Netherlands | 25.9 /100 | #189 | Fair 11.4% |