Osage vs Croatian In Labor Force | Age 16-19
COMPARE
Osage
Croatian
In Labor Force | Age 16-19
In Labor Force | Age 16-19 Comparison
Osage
Croatians
39.0%
IN LABOR FORCE | AGE 16-19
99.4/ 100
METRIC RATING
92nd/ 347
METRIC RANK
41.1%
IN LABOR FORCE | AGE 16-19
100.0/ 100
METRIC RATING
45th/ 347
METRIC RANK
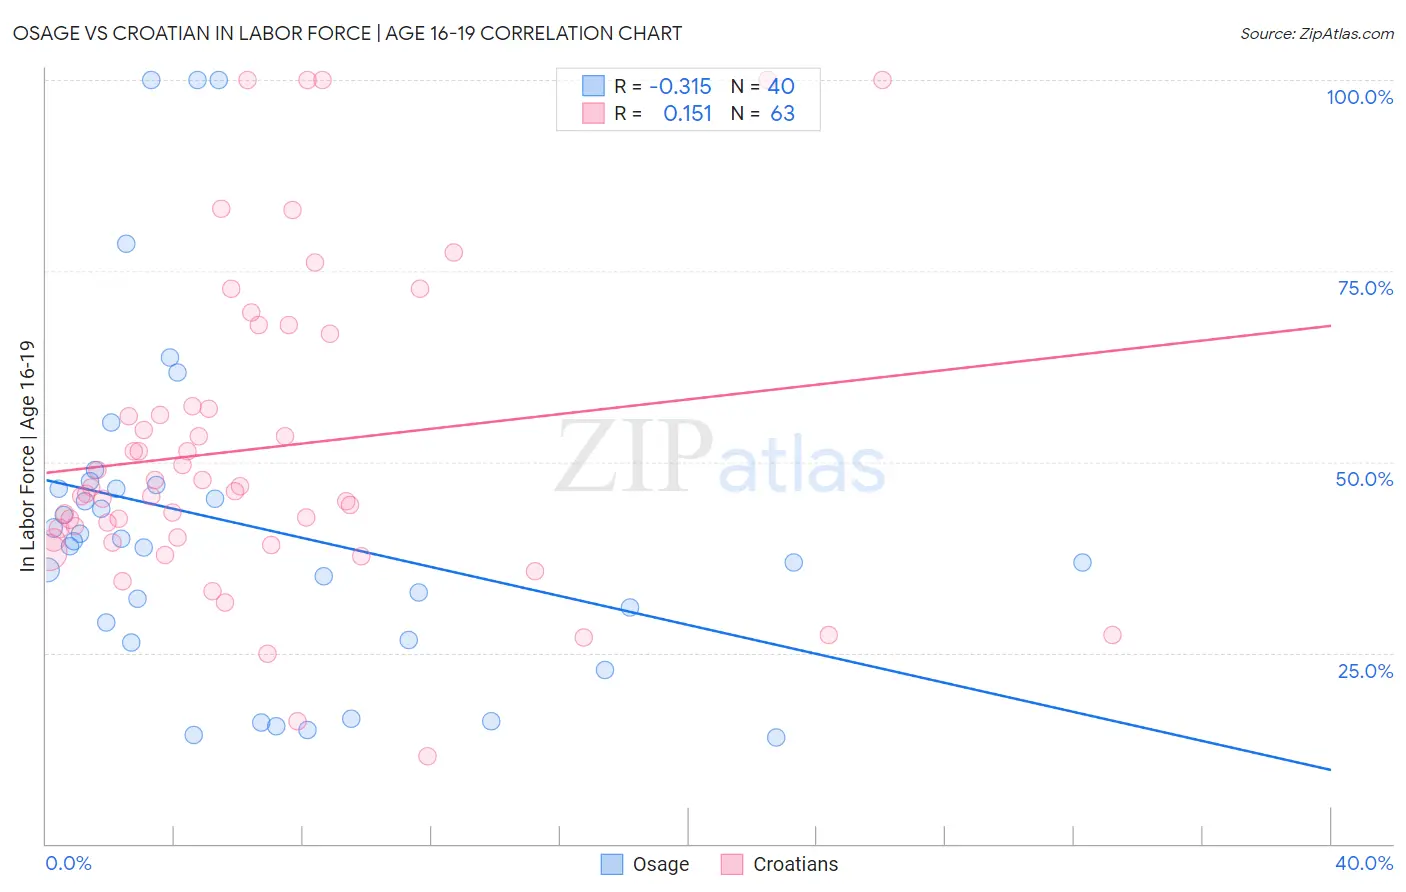
Osage vs Croatian In Labor Force | Age 16-19 Correlation Chart
The statistical analysis conducted on geographies consisting of 91,776,050 people shows a mild negative correlation between the proportion of Osage and labor force participation rate among population between the ages 16 and 19 in the United States with a correlation coefficient (R) of -0.315 and weighted average of 39.0%. Similarly, the statistical analysis conducted on geographies consisting of 375,104,825 people shows a poor positive correlation between the proportion of Croatians and labor force participation rate among population between the ages 16 and 19 in the United States with a correlation coefficient (R) of 0.151 and weighted average of 41.1%, a difference of 5.6%.
In Labor Force | Age 16-19 Correlation Summary
| Measurement | Osage | Croatian |
| Minimum | 13.9% | 11.5% |
| Maximum | 100.0% | 100.0% |
| Range | 86.1% | 88.5% |
| Mean | 41.6% | 51.8% |
| Median | 39.3% | 46.2% |
| Interquartile 25% (IQ1) | 27.8% | 39.8% |
| Interquartile 75% (IQ3) | 46.7% | 57.3% |
| Interquartile Range (IQR) | 19.0% | 17.4% |
| Standard Deviation (Sample) | 22.1% | 20.4% |
| Standard Deviation (Population) | 21.9% | 20.3% |
Similar Demographics by In Labor Force | Age 16-19
Demographics Similar to Osage by In Labor Force | Age 16-19
In terms of in labor force | age 16-19, the demographic groups most similar to Osage are Blackfeet (38.9%, a difference of 0.060%), Immigrants from Canada (38.9%, a difference of 0.060%), Spanish American (39.0%, a difference of 0.090%), Immigrants from North America (38.9%, a difference of 0.15%), and Latvian (38.9%, a difference of 0.18%).
| Demographics | Rating | Rank | In Labor Force | Age 16-19 |
| Creek | 99.6 /100 | #85 | Exceptional 39.1% |
| Samoans | 99.6 /100 | #86 | Exceptional 39.1% |
| Immigrants | Germany | 99.6 /100 | #87 | Exceptional 39.1% |
| Puget Sound Salish | 99.6 /100 | #88 | Exceptional 39.1% |
| Alaska Natives | 99.6 /100 | #89 | Exceptional 39.1% |
| Immigrants | Burma/Myanmar | 99.5 /100 | #90 | Exceptional 39.0% |
| Spanish Americans | 99.5 /100 | #91 | Exceptional 39.0% |
| Osage | 99.4 /100 | #92 | Exceptional 39.0% |
| Blackfeet | 99.4 /100 | #93 | Exceptional 38.9% |
| Immigrants | Canada | 99.4 /100 | #94 | Exceptional 38.9% |
| Immigrants | North America | 99.4 /100 | #95 | Exceptional 38.9% |
| Latvians | 99.4 /100 | #96 | Exceptional 38.9% |
| Greeks | 99.3 /100 | #97 | Exceptional 38.9% |
| Ugandans | 99.3 /100 | #98 | Exceptional 38.9% |
| Immigrants | North Macedonia | 99.3 /100 | #99 | Exceptional 38.9% |
Demographics Similar to Croatians by In Labor Force | Age 16-19
In terms of in labor force | age 16-19, the demographic groups most similar to Croatians are European (41.1%, a difference of 0.040%), Tongan (41.2%, a difference of 0.14%), Immigrants from Sudan (41.0%, a difference of 0.32%), Celtic (41.3%, a difference of 0.45%), and White/Caucasian (41.3%, a difference of 0.45%).
| Demographics | Rating | Rank | In Labor Force | Age 16-19 |
| Sioux | 100.0 /100 | #38 | Exceptional 41.5% |
| Scotch-Irish | 100.0 /100 | #39 | Exceptional 41.5% |
| Immigrants | Liberia | 100.0 /100 | #40 | Exceptional 41.5% |
| Celtics | 100.0 /100 | #41 | Exceptional 41.3% |
| Whites/Caucasians | 100.0 /100 | #42 | Exceptional 41.3% |
| Tongans | 100.0 /100 | #43 | Exceptional 41.2% |
| Europeans | 100.0 /100 | #44 | Exceptional 41.1% |
| Croatians | 100.0 /100 | #45 | Exceptional 41.1% |
| Immigrants | Sudan | 100.0 /100 | #46 | Exceptional 41.0% |
| Carpatho Rusyns | 100.0 /100 | #47 | Exceptional 40.8% |
| Icelanders | 100.0 /100 | #48 | Exceptional 40.8% |
| Cree | 100.0 /100 | #49 | Exceptional 40.8% |
| Indonesians | 100.0 /100 | #50 | Exceptional 40.7% |
| Immigrants | Zaire | 100.0 /100 | #51 | Exceptional 40.7% |
| Immigrants | Laos | 100.0 /100 | #52 | Exceptional 40.6% |