Osage vs Croatian 11th Grade
COMPARE
Osage
Croatian
11th Grade
11th Grade Comparison
Osage
Croatians
92.7%
11TH GRADE
73.4/ 100
METRIC RATING
154th/ 347
METRIC RANK
94.7%
11TH GRADE
100.0/ 100
METRIC RATING
8th/ 347
METRIC RANK
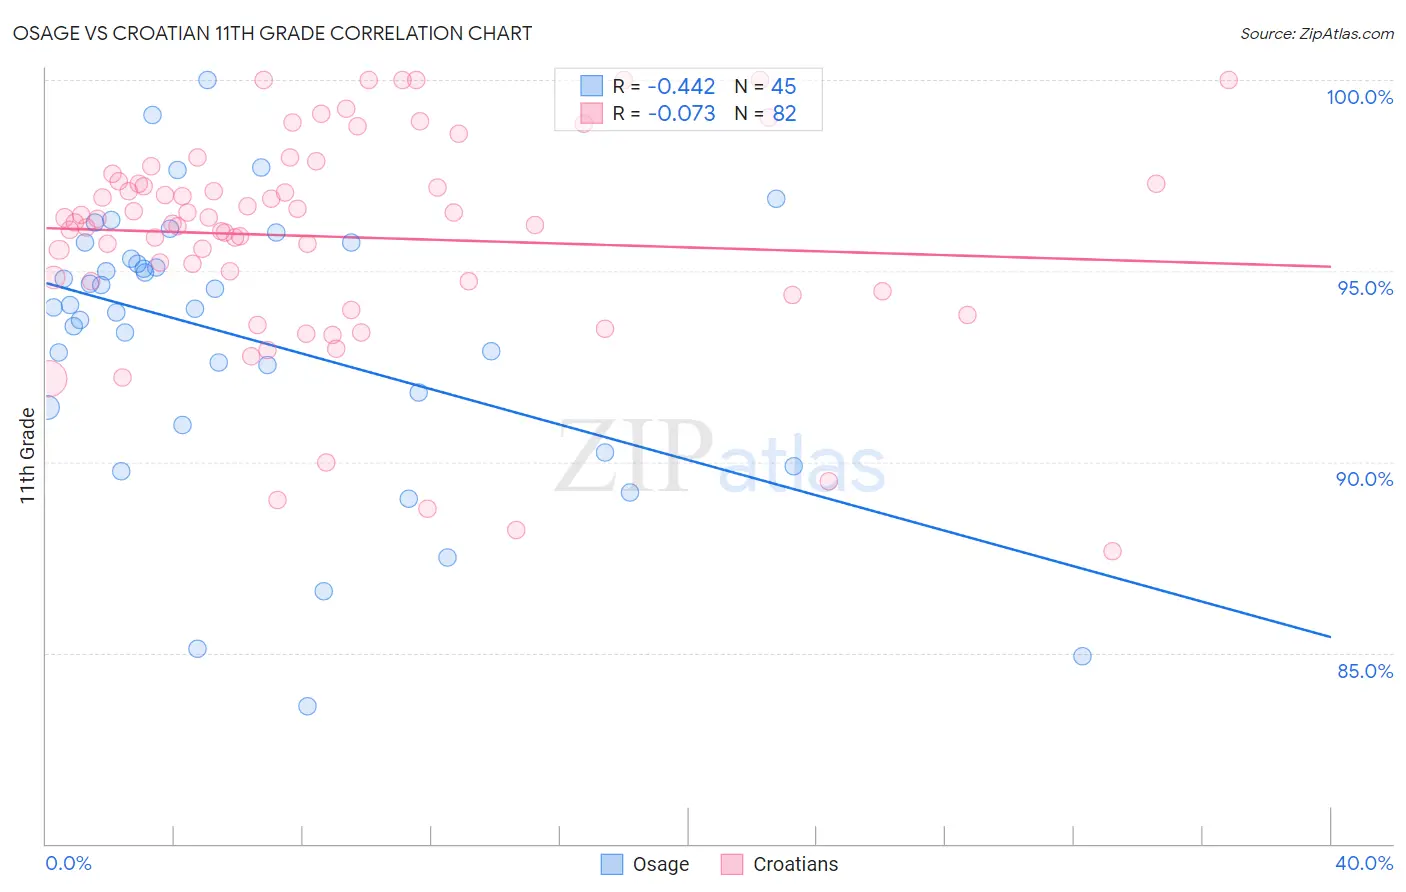
Osage vs Croatian 11th Grade Correlation Chart
The statistical analysis conducted on geographies consisting of 91,808,929 people shows a moderate negative correlation between the proportion of Osage and percentage of population with at least 11th grade education in the United States with a correlation coefficient (R) of -0.442 and weighted average of 92.7%. Similarly, the statistical analysis conducted on geographies consisting of 375,734,068 people shows a slight negative correlation between the proportion of Croatians and percentage of population with at least 11th grade education in the United States with a correlation coefficient (R) of -0.073 and weighted average of 94.7%, a difference of 2.1%.
11th Grade Correlation Summary
| Measurement | Osage | Croatian |
| Minimum | 83.6% | 87.7% |
| Maximum | 100.0% | 100.0% |
| Range | 16.4% | 12.3% |
| Mean | 93.2% | 95.9% |
| Median | 94.1% | 96.3% |
| Interquartile 25% (IQ1) | 91.2% | 94.7% |
| Interquartile 75% (IQ3) | 95.5% | 97.3% |
| Interquartile Range (IQR) | 4.3% | 2.6% |
| Standard Deviation (Sample) | 3.7% | 2.8% |
| Standard Deviation (Population) | 3.6% | 2.8% |
Similar Demographics by 11th Grade
Demographics Similar to Osage by 11th Grade
In terms of 11th grade, the demographic groups most similar to Osage are Argentinean (92.7%, a difference of 0.0%), Immigrants from Spain (92.7%, a difference of 0.0%), Potawatomi (92.8%, a difference of 0.010%), Iraqi (92.8%, a difference of 0.010%), and Brazilian (92.8%, a difference of 0.010%).
| Demographics | Rating | Rank | 11th Grade |
| Immigrants | Kenya | 78.7 /100 | #147 | Good 92.8% |
| Hmong | 78.6 /100 | #148 | Good 92.8% |
| Immigrants | Poland | 78.5 /100 | #149 | Good 92.8% |
| Immigrants | Egypt | 77.5 /100 | #150 | Good 92.8% |
| Potawatomi | 74.3 /100 | #151 | Good 92.8% |
| Iraqis | 74.2 /100 | #152 | Good 92.8% |
| Brazilians | 73.9 /100 | #153 | Good 92.8% |
| Osage | 73.4 /100 | #154 | Good 92.7% |
| Argentineans | 73.4 /100 | #155 | Good 92.7% |
| Immigrants | Spain | 73.0 /100 | #156 | Good 92.7% |
| Immigrants | Eastern Asia | 72.6 /100 | #157 | Good 92.7% |
| Immigrants | Venezuela | 72.0 /100 | #158 | Good 92.7% |
| Americans | 71.7 /100 | #159 | Good 92.7% |
| Immigrants | Lebanon | 70.7 /100 | #160 | Good 92.7% |
| Immigrants | Argentina | 69.8 /100 | #161 | Good 92.7% |
Demographics Similar to Croatians by 11th Grade
In terms of 11th grade, the demographic groups most similar to Croatians are Polish (94.8%, a difference of 0.010%), Danish (94.7%, a difference of 0.040%), Lithuanian (94.8%, a difference of 0.060%), Finnish (94.7%, a difference of 0.090%), and German (94.7%, a difference of 0.090%).
| Demographics | Rating | Rank | 11th Grade |
| Norwegians | 100.0 /100 | #1 | Exceptional 95.2% |
| Swedes | 100.0 /100 | #2 | Exceptional 94.9% |
| Slovenes | 100.0 /100 | #3 | Exceptional 94.9% |
| Slovaks | 100.0 /100 | #4 | Exceptional 94.9% |
| Carpatho Rusyns | 100.0 /100 | #5 | Exceptional 94.8% |
| Lithuanians | 100.0 /100 | #6 | Exceptional 94.8% |
| Poles | 100.0 /100 | #7 | Exceptional 94.8% |
| Croatians | 100.0 /100 | #8 | Exceptional 94.7% |
| Danes | 100.0 /100 | #9 | Exceptional 94.7% |
| Finns | 100.0 /100 | #10 | Exceptional 94.7% |
| Germans | 100.0 /100 | #11 | Exceptional 94.7% |
| Latvians | 100.0 /100 | #12 | Exceptional 94.7% |
| Chinese | 100.0 /100 | #13 | Exceptional 94.6% |
| Eastern Europeans | 100.0 /100 | #14 | Exceptional 94.6% |
| Bulgarians | 100.0 /100 | #15 | Exceptional 94.5% |