Immigrants from Sierra Leone vs Croatian Male Disability
COMPARE
Immigrants from Sierra Leone
Croatian
Male Disability
Male Disability Comparison
Immigrants from Sierra Leone
Croatians
10.5%
MALE DISABILITY
98.7/ 100
METRIC RATING
76th/ 347
METRIC RANK
11.8%
MALE DISABILITY
2.1/ 100
METRIC RATING
230th/ 347
METRIC RANK
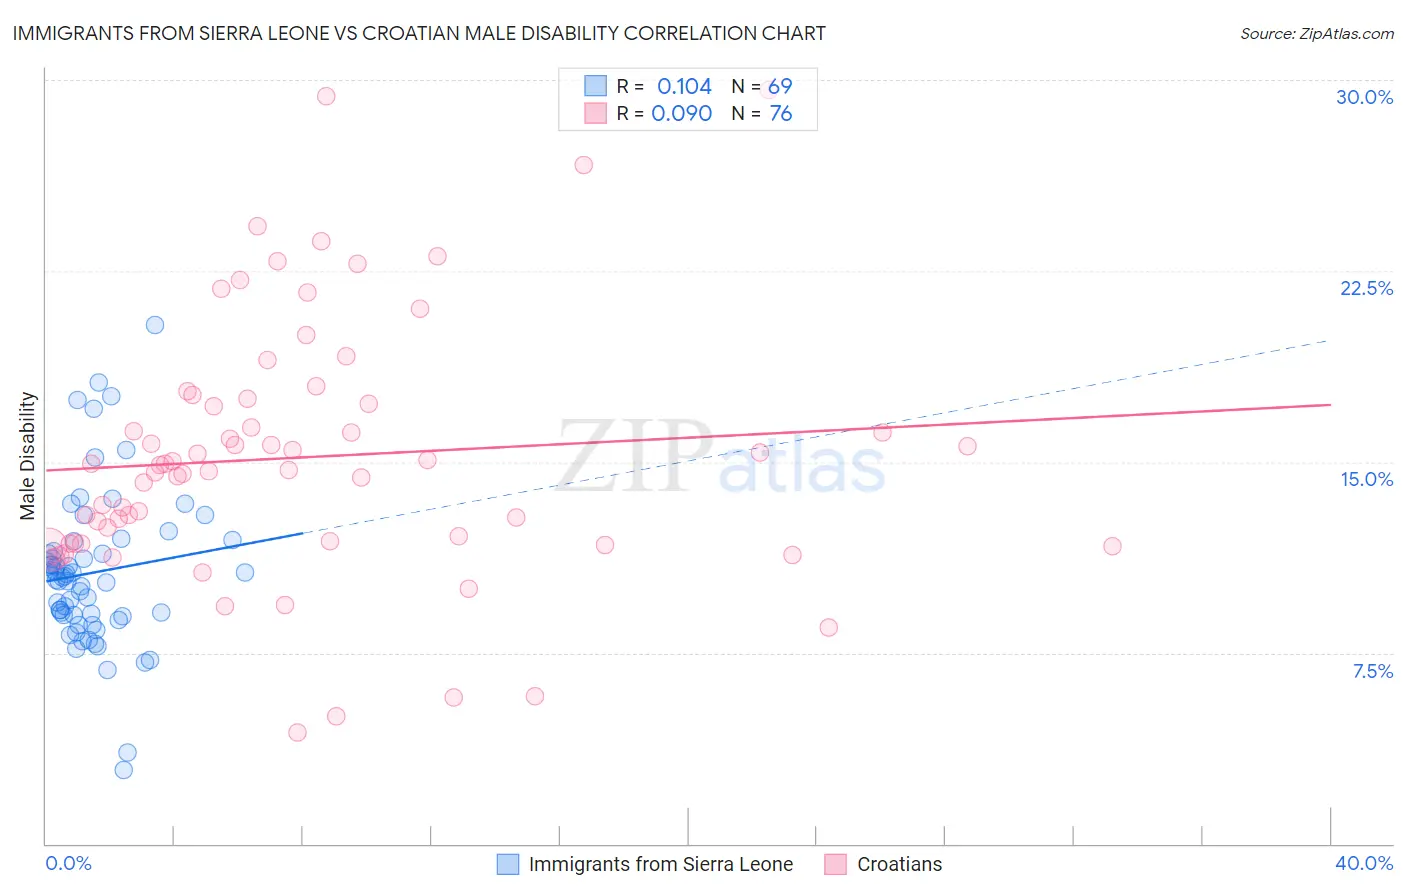
Immigrants from Sierra Leone vs Croatian Male Disability Correlation Chart
The statistical analysis conducted on geographies consisting of 101,648,107 people shows a poor positive correlation between the proportion of Immigrants from Sierra Leone and percentage of males with a disability in the United States with a correlation coefficient (R) of 0.104 and weighted average of 10.5%. Similarly, the statistical analysis conducted on geographies consisting of 375,704,968 people shows a slight positive correlation between the proportion of Croatians and percentage of males with a disability in the United States with a correlation coefficient (R) of 0.090 and weighted average of 11.8%, a difference of 12.0%.
Male Disability Correlation Summary
| Measurement | Immigrants from Sierra Leone | Croatian |
| Minimum | 2.9% | 4.4% |
| Maximum | 20.4% | 29.6% |
| Range | 17.5% | 25.2% |
| Mean | 10.6% | 15.2% |
| Median | 10.4% | 14.8% |
| Interquartile 25% (IQ1) | 8.9% | 11.8% |
| Interquartile 75% (IQ3) | 11.7% | 17.4% |
| Interquartile Range (IQR) | 2.8% | 5.6% |
| Standard Deviation (Sample) | 3.0% | 5.0% |
| Standard Deviation (Population) | 3.0% | 5.0% |
Similar Demographics by Male Disability
Demographics Similar to Immigrants from Sierra Leone by Male Disability
In terms of male disability, the demographic groups most similar to Immigrants from Sierra Leone are Sierra Leonean (10.5%, a difference of 0.040%), Laotian (10.6%, a difference of 0.060%), Immigrants from Russia (10.6%, a difference of 0.080%), Immigrants from Lebanon (10.5%, a difference of 0.16%), and Immigrants from Lithuania (10.5%, a difference of 0.30%).
| Demographics | Rating | Rank | Male Disability |
| Ecuadorians | 99.2 /100 | #69 | Exceptional 10.5% |
| Immigrants | Bulgaria | 99.1 /100 | #70 | Exceptional 10.5% |
| Immigrants | Cameroon | 99.0 /100 | #71 | Exceptional 10.5% |
| Immigrants | Serbia | 99.0 /100 | #72 | Exceptional 10.5% |
| Immigrants | Lithuania | 98.9 /100 | #73 | Exceptional 10.5% |
| Immigrants | Lebanon | 98.8 /100 | #74 | Exceptional 10.5% |
| Sierra Leoneans | 98.7 /100 | #75 | Exceptional 10.5% |
| Immigrants | Sierra Leone | 98.7 /100 | #76 | Exceptional 10.5% |
| Laotians | 98.6 /100 | #77 | Exceptional 10.6% |
| Immigrants | Russia | 98.6 /100 | #78 | Exceptional 10.6% |
| Zimbabweans | 98.4 /100 | #79 | Exceptional 10.6% |
| Immigrants | Jordan | 98.4 /100 | #80 | Exceptional 10.6% |
| Immigrants | Chile | 98.3 /100 | #81 | Exceptional 10.6% |
| Immigrants | Guyana | 98.2 /100 | #82 | Exceptional 10.6% |
| Immigrants | Poland | 98.1 /100 | #83 | Exceptional 10.6% |
Demographics Similar to Croatians by Male Disability
In terms of male disability, the demographic groups most similar to Croatians are Bermudan (11.8%, a difference of 0.090%), Hispanic or Latino (11.8%, a difference of 0.12%), Austrian (11.8%, a difference of 0.20%), Dominican (11.8%, a difference of 0.20%), and Malaysian (11.8%, a difference of 0.26%).
| Demographics | Rating | Rank | Male Disability |
| Immigrants | Bahamas | 3.2 /100 | #223 | Tragic 11.7% |
| Japanese | 3.1 /100 | #224 | Tragic 11.7% |
| Liberians | 3.1 /100 | #225 | Tragic 11.8% |
| Sub-Saharan Africans | 2.8 /100 | #226 | Tragic 11.8% |
| Austrians | 2.5 /100 | #227 | Tragic 11.8% |
| Hispanics or Latinos | 2.3 /100 | #228 | Tragic 11.8% |
| Bermudans | 2.3 /100 | #229 | Tragic 11.8% |
| Croatians | 2.1 /100 | #230 | Tragic 11.8% |
| Dominicans | 1.8 /100 | #231 | Tragic 11.8% |
| Malaysians | 1.8 /100 | #232 | Tragic 11.8% |
| Mexicans | 1.7 /100 | #233 | Tragic 11.8% |
| Immigrants | Canada | 1.6 /100 | #234 | Tragic 11.9% |
| Immigrants | North America | 1.5 /100 | #235 | Tragic 11.9% |
| U.S. Virgin Islanders | 1.3 /100 | #236 | Tragic 11.9% |
| Carpatho Rusyns | 1.3 /100 | #237 | Tragic 11.9% |