Osage vs Croatian 9th Grade
COMPARE
Osage
Croatian
9th Grade
9th Grade Comparison
Osage
Croatians
95.5%
9TH GRADE
96.8/ 100
METRIC RATING
109th/ 347
METRIC RANK
96.5%
9TH GRADE
100.0/ 100
METRIC RATING
16th/ 347
METRIC RANK
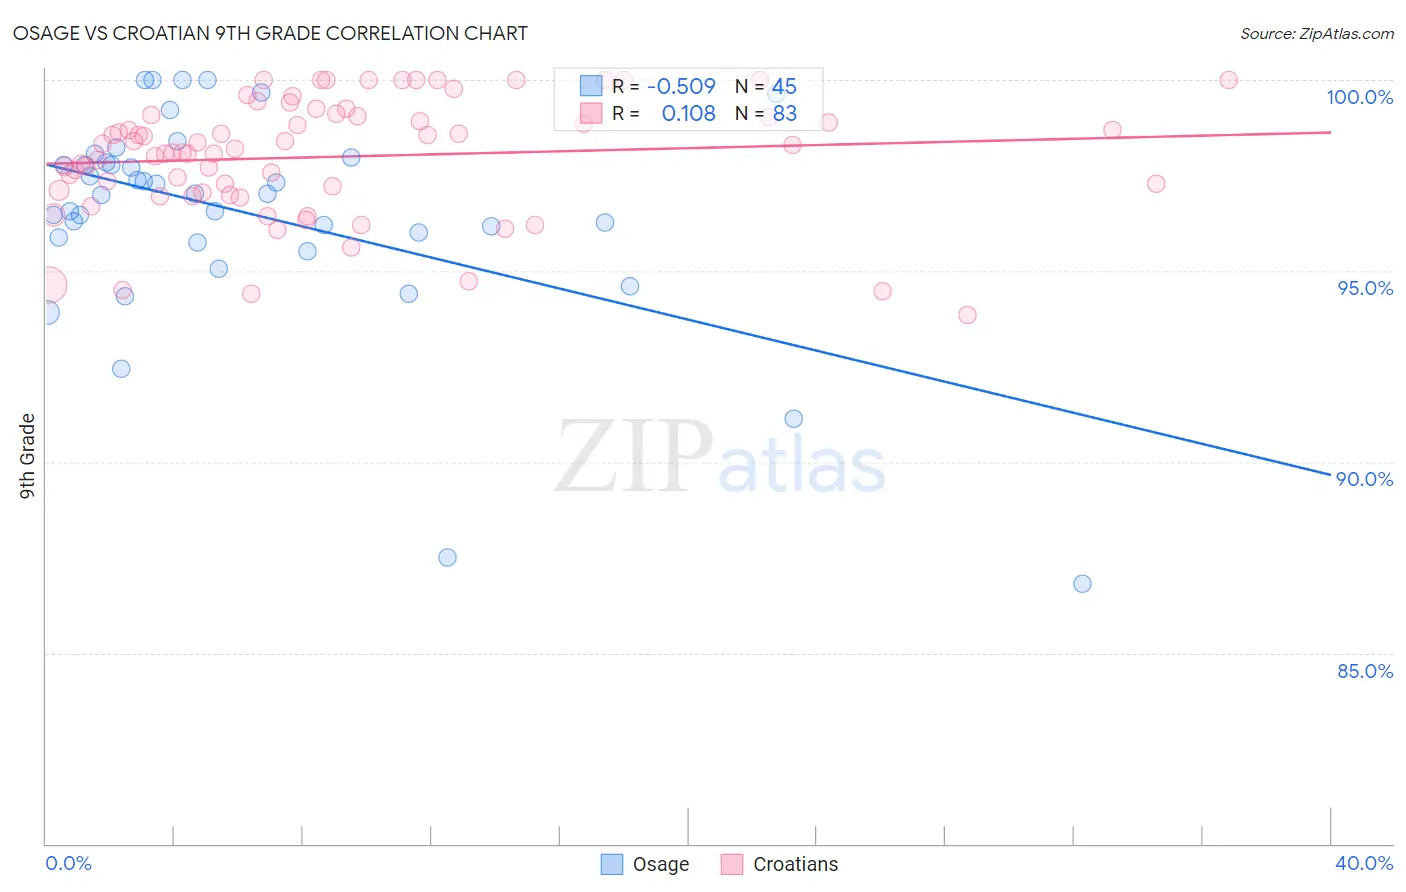
Osage vs Croatian 9th Grade Correlation Chart
The statistical analysis conducted on geographies consisting of 91,808,929 people shows a substantial negative correlation between the proportion of Osage and percentage of population with at least 9th grade education in the United States with a correlation coefficient (R) of -0.509 and weighted average of 95.5%. Similarly, the statistical analysis conducted on geographies consisting of 375,734,264 people shows a poor positive correlation between the proportion of Croatians and percentage of population with at least 9th grade education in the United States with a correlation coefficient (R) of 0.108 and weighted average of 96.5%, a difference of 1.1%.
9th Grade Correlation Summary
| Measurement | Osage | Croatian |
| Minimum | 86.8% | 93.9% |
| Maximum | 100.0% | 100.0% |
| Range | 13.2% | 6.1% |
| Mean | 96.5% | 98.0% |
| Median | 97.0% | 98.2% |
| Interquartile 25% (IQ1) | 95.8% | 97.1% |
| Interquartile 75% (IQ3) | 97.9% | 99.1% |
| Interquartile Range (IQR) | 2.1% | 2.0% |
| Standard Deviation (Sample) | 2.8% | 1.5% |
| Standard Deviation (Population) | 2.8% | 1.5% |
Similar Demographics by 9th Grade
Demographics Similar to Osage by 9th Grade
In terms of 9th grade, the demographic groups most similar to Osage are Chickasaw (95.5%, a difference of 0.0%), Immigrants from Bulgaria (95.5%, a difference of 0.0%), Immigrants from Zimbabwe (95.5%, a difference of 0.010%), Immigrants from Norway (95.5%, a difference of 0.020%), and Cherokee (95.4%, a difference of 0.030%).
| Demographics | Rating | Rank | 9th Grade |
| Immigrants | Switzerland | 97.7 /100 | #102 | Exceptional 95.5% |
| Potawatomi | 97.7 /100 | #103 | Exceptional 95.5% |
| Syrians | 97.4 /100 | #104 | Exceptional 95.5% |
| Immigrants | France | 97.4 /100 | #105 | Exceptional 95.5% |
| Immigrants | Norway | 97.1 /100 | #106 | Exceptional 95.5% |
| Immigrants | Zimbabwe | 96.9 /100 | #107 | Exceptional 95.5% |
| Chickasaw | 96.8 /100 | #108 | Exceptional 95.5% |
| Osage | 96.8 /100 | #109 | Exceptional 95.5% |
| Immigrants | Bulgaria | 96.7 /100 | #110 | Exceptional 95.5% |
| Cherokee | 96.3 /100 | #111 | Exceptional 95.4% |
| Immigrants | Croatia | 96.2 /100 | #112 | Exceptional 95.4% |
| Iroquois | 96.2 /100 | #113 | Exceptional 95.4% |
| German Russians | 96.1 /100 | #114 | Exceptional 95.4% |
| Burmese | 96.0 /100 | #115 | Exceptional 95.4% |
| Immigrants | Europe | 95.7 /100 | #116 | Exceptional 95.4% |
Demographics Similar to Croatians by 9th Grade
In terms of 9th grade, the demographic groups most similar to Croatians are Scottish (96.5%, a difference of 0.0%), Irish (96.5%, a difference of 0.0%), Danish (96.5%, a difference of 0.010%), English (96.6%, a difference of 0.050%), and Dutch (96.5%, a difference of 0.060%).
| Demographics | Rating | Rank | 9th Grade |
| Tlingit-Haida | 100.0 /100 | #9 | Exceptional 96.6% |
| Lithuanians | 100.0 /100 | #10 | Exceptional 96.6% |
| Finns | 100.0 /100 | #11 | Exceptional 96.6% |
| English | 100.0 /100 | #12 | Exceptional 96.6% |
| Danes | 100.0 /100 | #13 | Exceptional 96.5% |
| Scottish | 100.0 /100 | #14 | Exceptional 96.5% |
| Irish | 100.0 /100 | #15 | Exceptional 96.5% |
| Croatians | 100.0 /100 | #16 | Exceptional 96.5% |
| Dutch | 100.0 /100 | #17 | Exceptional 96.5% |
| Scandinavians | 100.0 /100 | #18 | Exceptional 96.5% |
| Welsh | 100.0 /100 | #19 | Exceptional 96.4% |
| Italians | 100.0 /100 | #20 | Exceptional 96.4% |
| Alaskan Athabascans | 100.0 /100 | #21 | Exceptional 96.4% |
| Europeans | 100.0 /100 | #22 | Exceptional 96.4% |
| Czechs | 100.0 /100 | #23 | Exceptional 96.4% |