Cuban vs Croatian Male Disability
COMPARE
Cuban
Croatian
Male Disability
Male Disability Comparison
Cubans
Croatians
11.0%
MALE DISABILITY
74.9/ 100
METRIC RATING
151st/ 347
METRIC RANK
11.8%
MALE DISABILITY
2.1/ 100
METRIC RATING
230th/ 347
METRIC RANK
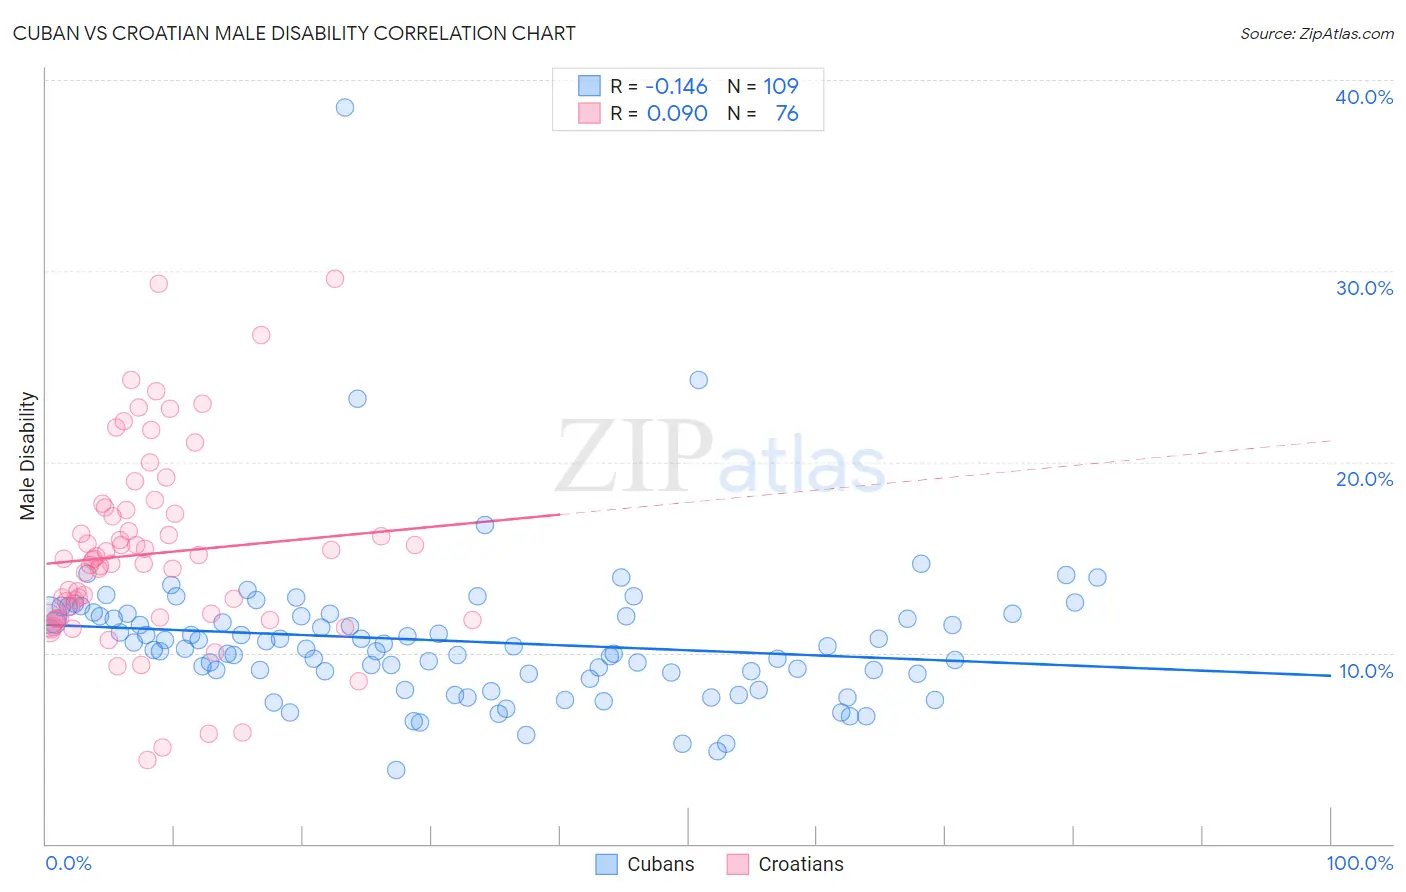
Cuban vs Croatian Male Disability Correlation Chart
The statistical analysis conducted on geographies consisting of 449,227,297 people shows a poor negative correlation between the proportion of Cubans and percentage of males with a disability in the United States with a correlation coefficient (R) of -0.146 and weighted average of 11.0%. Similarly, the statistical analysis conducted on geographies consisting of 375,704,968 people shows a slight positive correlation between the proportion of Croatians and percentage of males with a disability in the United States with a correlation coefficient (R) of 0.090 and weighted average of 11.8%, a difference of 6.9%.
Male Disability Correlation Summary
| Measurement | Cuban | Croatian |
| Minimum | 3.9% | 4.4% |
| Maximum | 38.6% | 29.6% |
| Range | 34.7% | 25.2% |
| Mean | 10.6% | 15.2% |
| Median | 10.2% | 14.8% |
| Interquartile 25% (IQ1) | 8.9% | 11.8% |
| Interquartile 75% (IQ3) | 11.9% | 17.4% |
| Interquartile Range (IQR) | 3.0% | 5.6% |
| Standard Deviation (Sample) | 4.0% | 5.0% |
| Standard Deviation (Population) | 4.0% | 5.0% |
Similar Demographics by Male Disability
Demographics Similar to Cubans by Male Disability
In terms of male disability, the demographic groups most similar to Cubans are Immigrants from Guatemala (11.0%, a difference of 0.020%), Immigrants from Albania (11.0%, a difference of 0.030%), Immigrants from Denmark (11.0%, a difference of 0.12%), Immigrants from Northern Europe (11.1%, a difference of 0.12%), and Immigrants from Moldova (11.1%, a difference of 0.15%).
| Demographics | Rating | Rank | Male Disability |
| Kenyans | 78.1 /100 | #144 | Good 11.0% |
| Costa Ricans | 78.0 /100 | #145 | Good 11.0% |
| Koreans | 77.5 /100 | #146 | Good 11.0% |
| Immigrants | Croatia | 77.3 /100 | #147 | Good 11.0% |
| Sudanese | 77.1 /100 | #148 | Good 11.0% |
| Immigrants | Denmark | 76.4 /100 | #149 | Good 11.0% |
| Immigrants | Guatemala | 75.1 /100 | #150 | Good 11.0% |
| Cubans | 74.9 /100 | #151 | Good 11.0% |
| Immigrants | Albania | 74.4 /100 | #152 | Good 11.0% |
| Immigrants | Northern Europe | 73.2 /100 | #153 | Good 11.1% |
| Immigrants | Moldova | 72.8 /100 | #154 | Good 11.1% |
| Immigrants | Middle Africa | 70.9 /100 | #155 | Good 11.1% |
| Russians | 69.8 /100 | #156 | Good 11.1% |
| Immigrants | Western Africa | 69.2 /100 | #157 | Good 11.1% |
| Latvians | 68.1 /100 | #158 | Good 11.1% |
Demographics Similar to Croatians by Male Disability
In terms of male disability, the demographic groups most similar to Croatians are Bermudan (11.8%, a difference of 0.090%), Hispanic or Latino (11.8%, a difference of 0.12%), Austrian (11.8%, a difference of 0.20%), Dominican (11.8%, a difference of 0.20%), and Malaysian (11.8%, a difference of 0.26%).
| Demographics | Rating | Rank | Male Disability |
| Immigrants | Bahamas | 3.2 /100 | #223 | Tragic 11.7% |
| Japanese | 3.1 /100 | #224 | Tragic 11.7% |
| Liberians | 3.1 /100 | #225 | Tragic 11.8% |
| Sub-Saharan Africans | 2.8 /100 | #226 | Tragic 11.8% |
| Austrians | 2.5 /100 | #227 | Tragic 11.8% |
| Hispanics or Latinos | 2.3 /100 | #228 | Tragic 11.8% |
| Bermudans | 2.3 /100 | #229 | Tragic 11.8% |
| Croatians | 2.1 /100 | #230 | Tragic 11.8% |
| Dominicans | 1.8 /100 | #231 | Tragic 11.8% |
| Malaysians | 1.8 /100 | #232 | Tragic 11.8% |
| Mexicans | 1.7 /100 | #233 | Tragic 11.8% |
| Immigrants | Canada | 1.6 /100 | #234 | Tragic 11.9% |
| Immigrants | North America | 1.5 /100 | #235 | Tragic 11.9% |
| U.S. Virgin Islanders | 1.3 /100 | #236 | Tragic 11.9% |
| Carpatho Rusyns | 1.3 /100 | #237 | Tragic 11.9% |