Native/Alaskan vs Immigrants from Congo Male Disability
COMPARE
Native/Alaskan
Immigrants from Congo
Male Disability
Male Disability Comparison
Natives/Alaskans
Immigrants from Congo
14.2%
MALE DISABILITY
0.0/ 100
METRIC RATING
326th/ 347
METRIC RANK
11.7%
MALE DISABILITY
3.7/ 100
METRIC RATING
221st/ 347
METRIC RANK
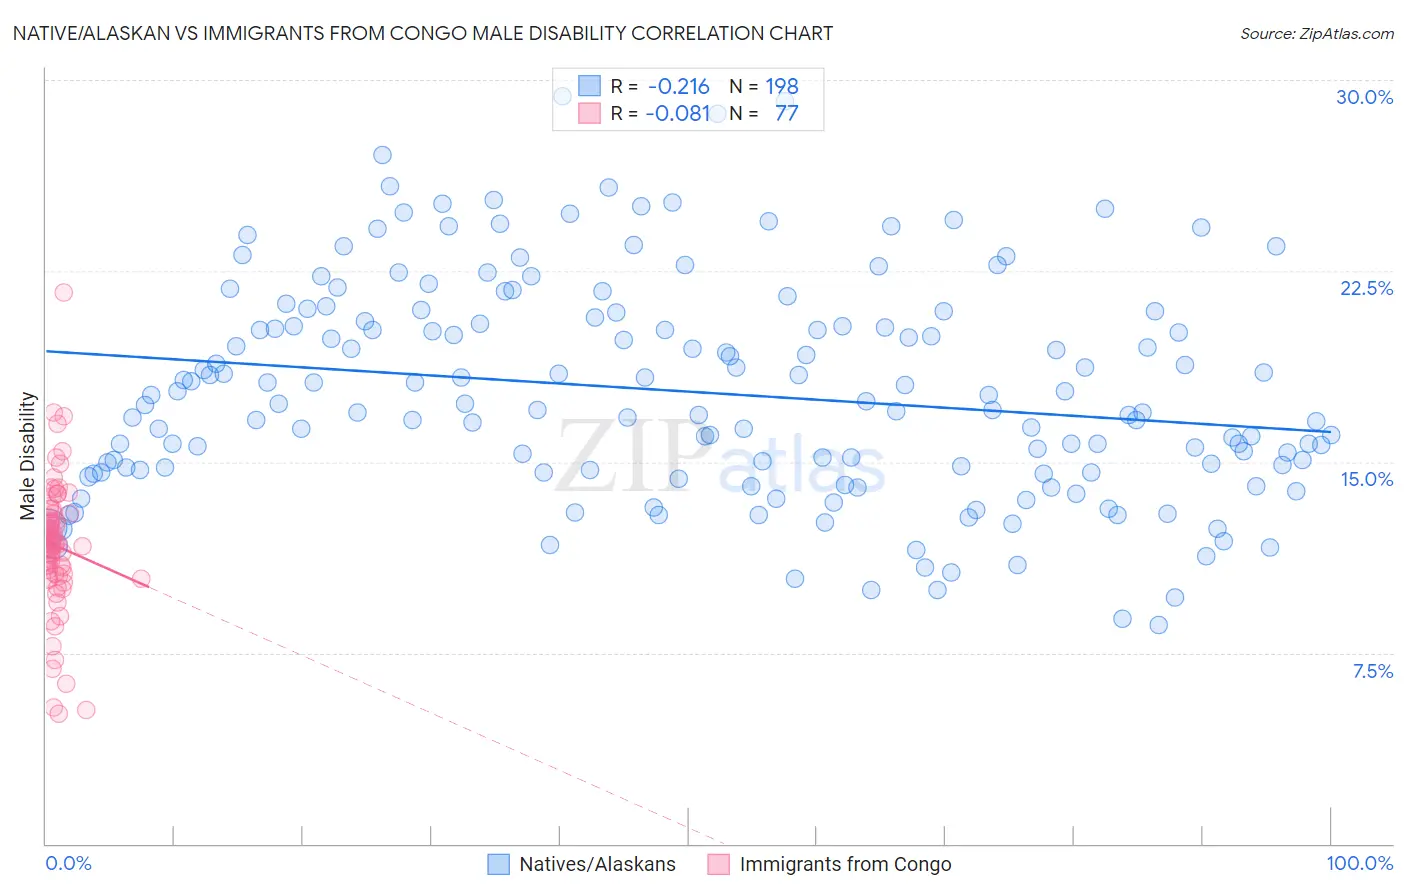
Native/Alaskan vs Immigrants from Congo Male Disability Correlation Chart
The statistical analysis conducted on geographies consisting of 512,854,069 people shows a weak negative correlation between the proportion of Natives/Alaskans and percentage of males with a disability in the United States with a correlation coefficient (R) of -0.216 and weighted average of 14.2%. Similarly, the statistical analysis conducted on geographies consisting of 92,121,223 people shows a slight negative correlation between the proportion of Immigrants from Congo and percentage of males with a disability in the United States with a correlation coefficient (R) of -0.081 and weighted average of 11.7%, a difference of 21.2%.
Male Disability Correlation Summary
| Measurement | Native/Alaskan | Immigrants from Congo |
| Minimum | 8.6% | 5.1% |
| Maximum | 29.4% | 21.7% |
| Range | 20.8% | 16.5% |
| Mean | 17.8% | 11.7% |
| Median | 17.3% | 11.8% |
| Interquartile 25% (IQ1) | 14.7% | 10.6% |
| Interquartile 75% (IQ3) | 20.5% | 12.9% |
| Interquartile Range (IQR) | 5.9% | 2.4% |
| Standard Deviation (Sample) | 4.3% | 2.7% |
| Standard Deviation (Population) | 4.3% | 2.6% |
Similar Demographics by Male Disability
Demographics Similar to Natives/Alaskans by Male Disability
In terms of male disability, the demographic groups most similar to Natives/Alaskans are Potawatomi (14.2%, a difference of 0.10%), Chippewa (14.3%, a difference of 0.53%), Ottawa (14.1%, a difference of 0.94%), Comanche (14.1%, a difference of 1.1%), and Cajun (14.4%, a difference of 1.1%).
| Demographics | Rating | Rank | Male Disability |
| Americans | 0.0 /100 | #319 | Tragic 13.8% |
| Tlingit-Haida | 0.0 /100 | #320 | Tragic 13.8% |
| Shoshone | 0.0 /100 | #321 | Tragic 13.8% |
| Apache | 0.0 /100 | #322 | Tragic 14.0% |
| Osage | 0.0 /100 | #323 | Tragic 14.0% |
| Comanche | 0.0 /100 | #324 | Tragic 14.1% |
| Ottawa | 0.0 /100 | #325 | Tragic 14.1% |
| Natives/Alaskans | 0.0 /100 | #326 | Tragic 14.2% |
| Potawatomi | 0.0 /100 | #327 | Tragic 14.2% |
| Chippewa | 0.0 /100 | #328 | Tragic 14.3% |
| Cajuns | 0.0 /100 | #329 | Tragic 14.4% |
| Navajo | 0.0 /100 | #330 | Tragic 14.4% |
| Tohono O'odham | 0.0 /100 | #331 | Tragic 14.6% |
| Seminole | 0.0 /100 | #332 | Tragic 14.7% |
| Yuman | 0.0 /100 | #333 | Tragic 14.7% |
Demographics Similar to Immigrants from Congo by Male Disability
In terms of male disability, the demographic groups most similar to Immigrants from Congo are Immigrants from Western Europe (11.7%, a difference of 0.010%), Panamanian (11.7%, a difference of 0.020%), Immigrants from England (11.7%, a difference of 0.080%), Alsatian (11.7%, a difference of 0.15%), and Immigrants from Bahamas (11.7%, a difference of 0.24%).
| Demographics | Rating | Rank | Male Disability |
| Lithuanians | 6.6 /100 | #214 | Tragic 11.6% |
| Indonesians | 5.9 /100 | #215 | Tragic 11.6% |
| Immigrants | Dominican Republic | 4.9 /100 | #216 | Tragic 11.7% |
| Immigrants | Dominica | 4.6 /100 | #217 | Tragic 11.7% |
| Immigrants | England | 4.0 /100 | #218 | Tragic 11.7% |
| Panamanians | 3.8 /100 | #219 | Tragic 11.7% |
| Immigrants | Western Europe | 3.8 /100 | #220 | Tragic 11.7% |
| Immigrants | Congo | 3.7 /100 | #221 | Tragic 11.7% |
| Alsatians | 3.3 /100 | #222 | Tragic 11.7% |
| Immigrants | Bahamas | 3.2 /100 | #223 | Tragic 11.7% |
| Japanese | 3.1 /100 | #224 | Tragic 11.7% |
| Liberians | 3.1 /100 | #225 | Tragic 11.8% |
| Sub-Saharan Africans | 2.8 /100 | #226 | Tragic 11.8% |
| Austrians | 2.5 /100 | #227 | Tragic 11.8% |
| Hispanics or Latinos | 2.3 /100 | #228 | Tragic 11.8% |